
Carrier BNG operations
Watch it run. Don't read the report afterwards.
A five-second live feed of every gateway you operate — and of any single gateway you open. Same agent, same socket, no extra collector. Press one button.
A subscriber complaint takes ninety seconds to reach you. On a thirty-second poll, the event that caused it has already been averaged into the background before you open the page.
fleet-wide
at once
or collectors
streams unasked
The problem is the gap, not the graph
Every monitoring system draws a line. The question is what happened between the points. A PPPoE storm that re-authenticates four thousand subscribers can start and finish inside one polling interval, and the only trace it leaves on a thirty-second average is a bump you would not look twice at.
The same incident, against two sampling rates. Nothing about the second row is cleverer — it simply looks often enough to catch something that lasts under a minute.
Two consoles, one socket
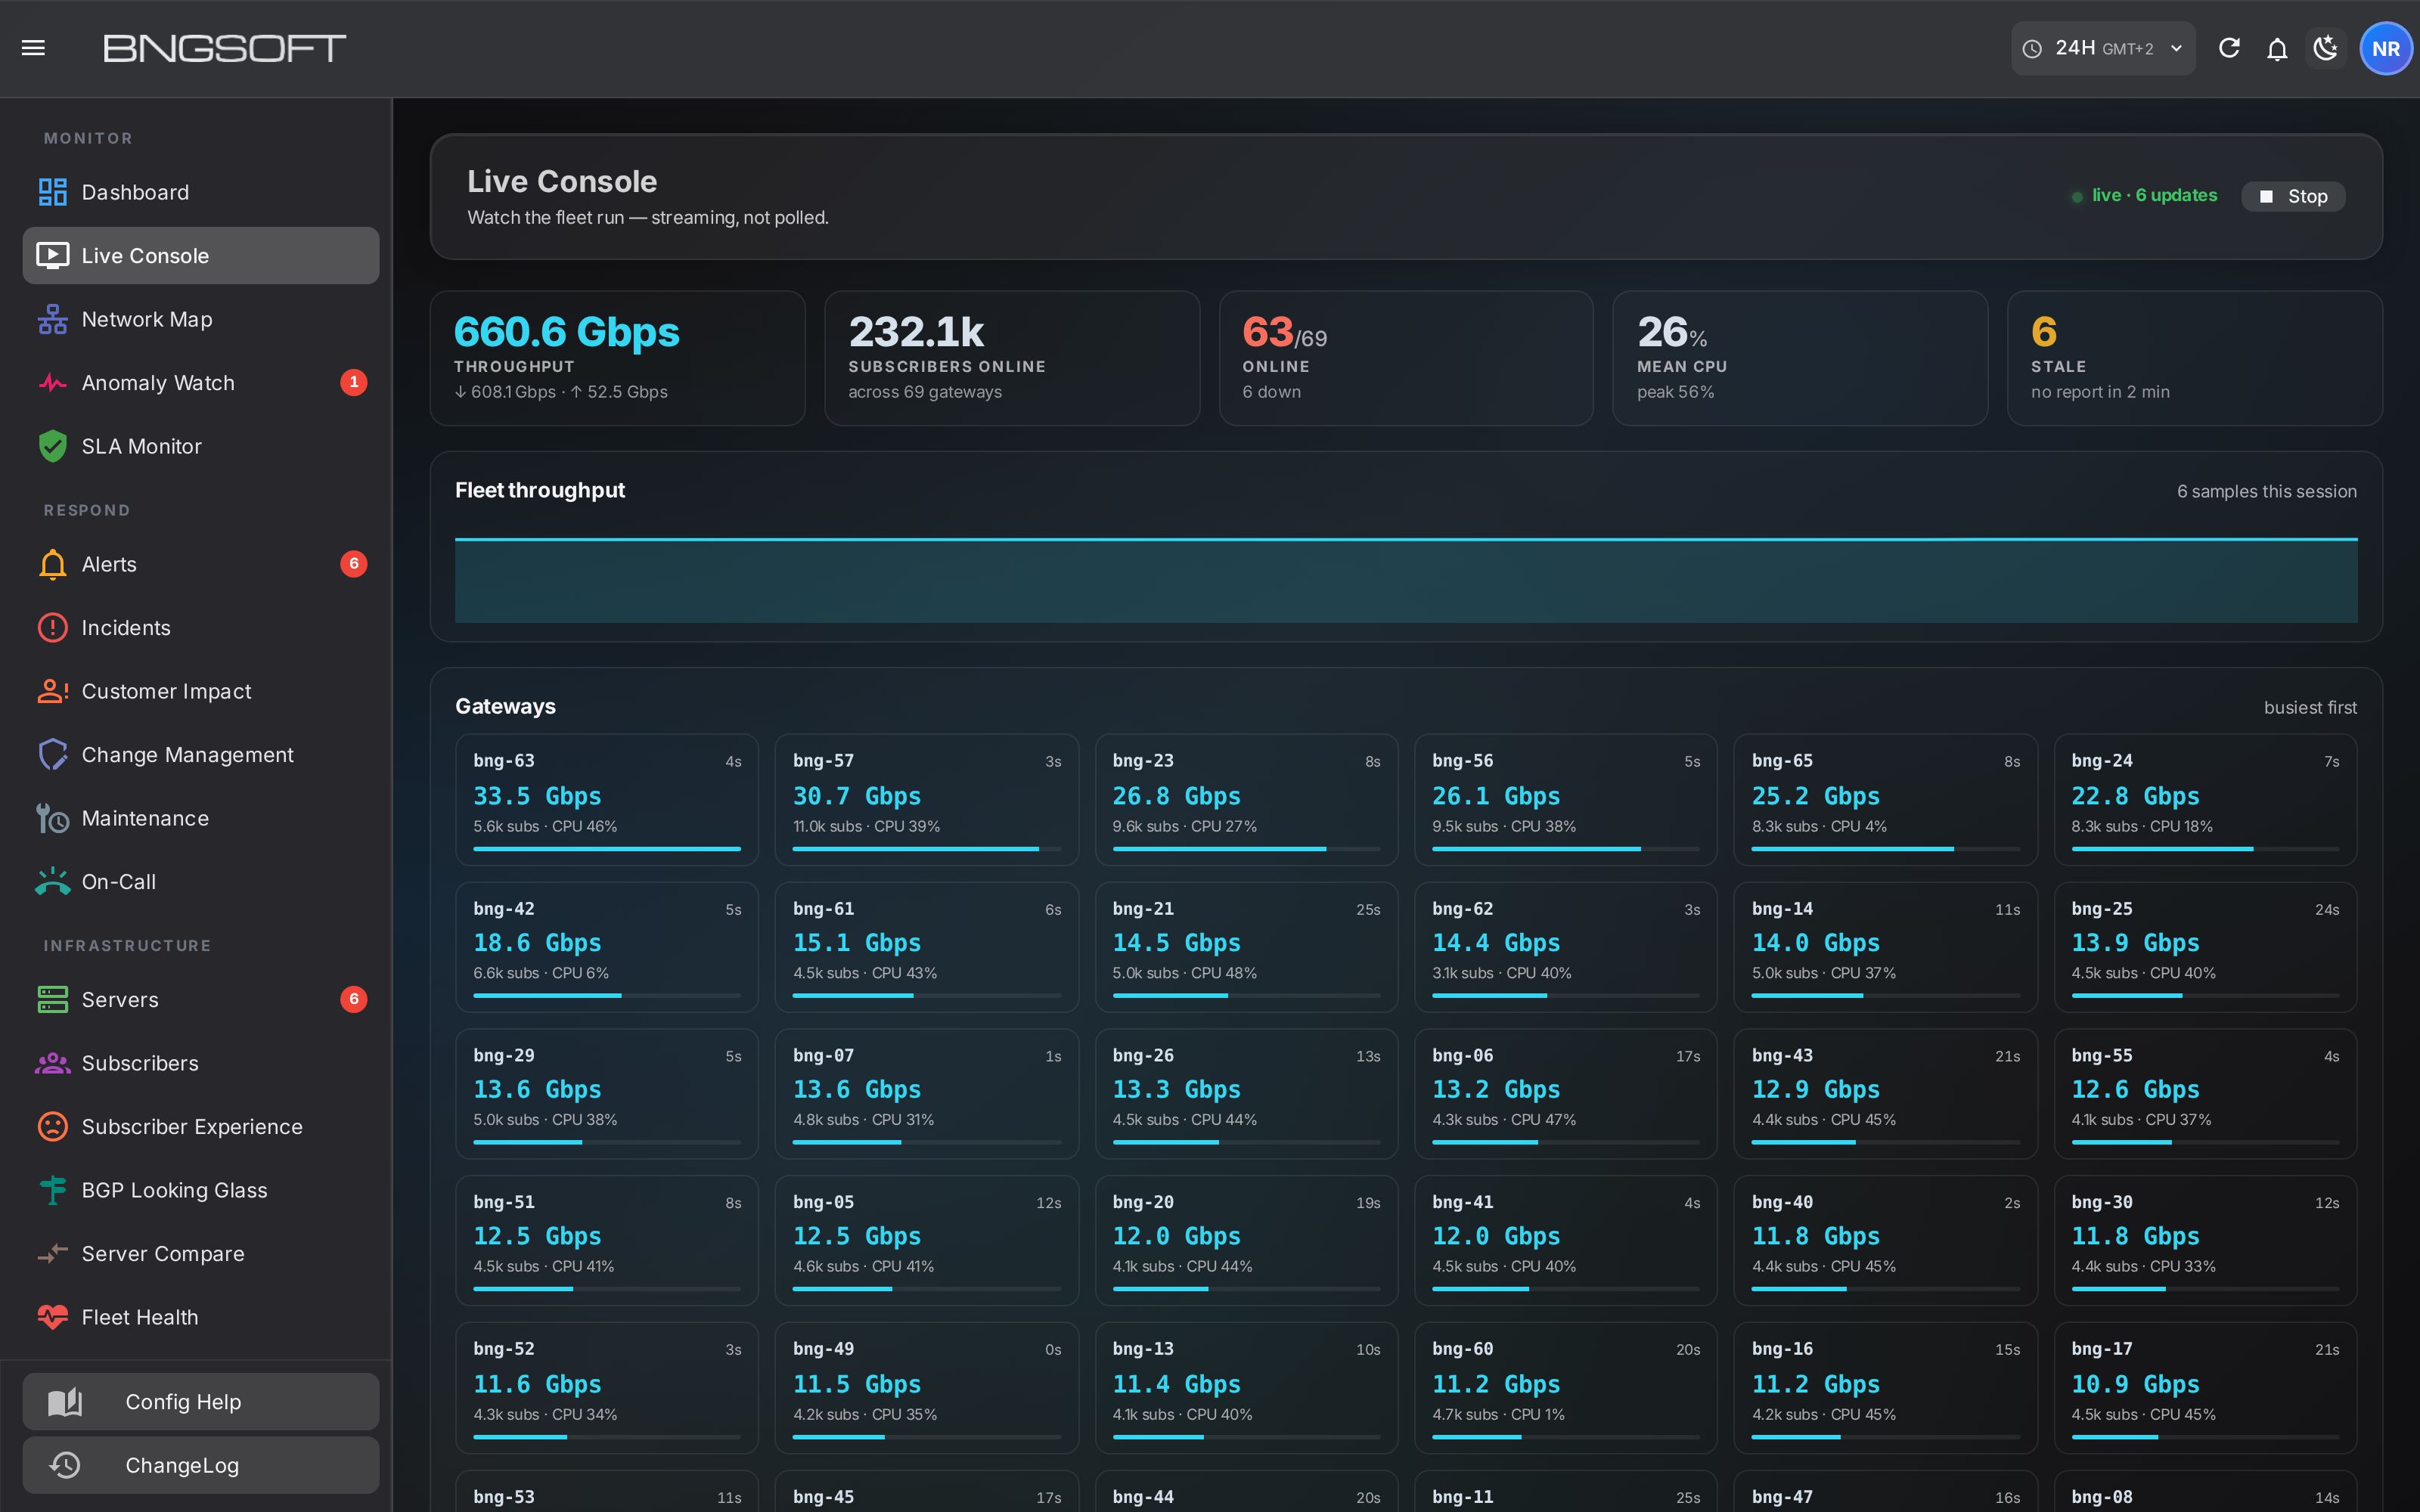
Every gateway at once
"Is it us, or is it that one BNG?"
- Total throughput, subscribers online, gateways up, mean CPU — all moving
- Every gateway as a live tile, busiest first, with seconds since its last report
- Stale gateways called out by name rather than silently holding an old number
One gateway, up close
"What is this box doing right now?"
- Live inside the server view — the Traffic Path tab, no separate screen to find
- Sessions, throughput, CPU and memory ticking, with the subscriber path beneath
- Per-interface bit rate, packet rate and NIC loss refreshing alongside
It does not just show numbers — it says what they mean
A live number is only useful if you know whether it is normal. Thirty gigabits at nine in the evening is a quiet night; the same figure at four in the morning is an incident. The gateway console answers that for you, in a sentence, before you have read a single chart.
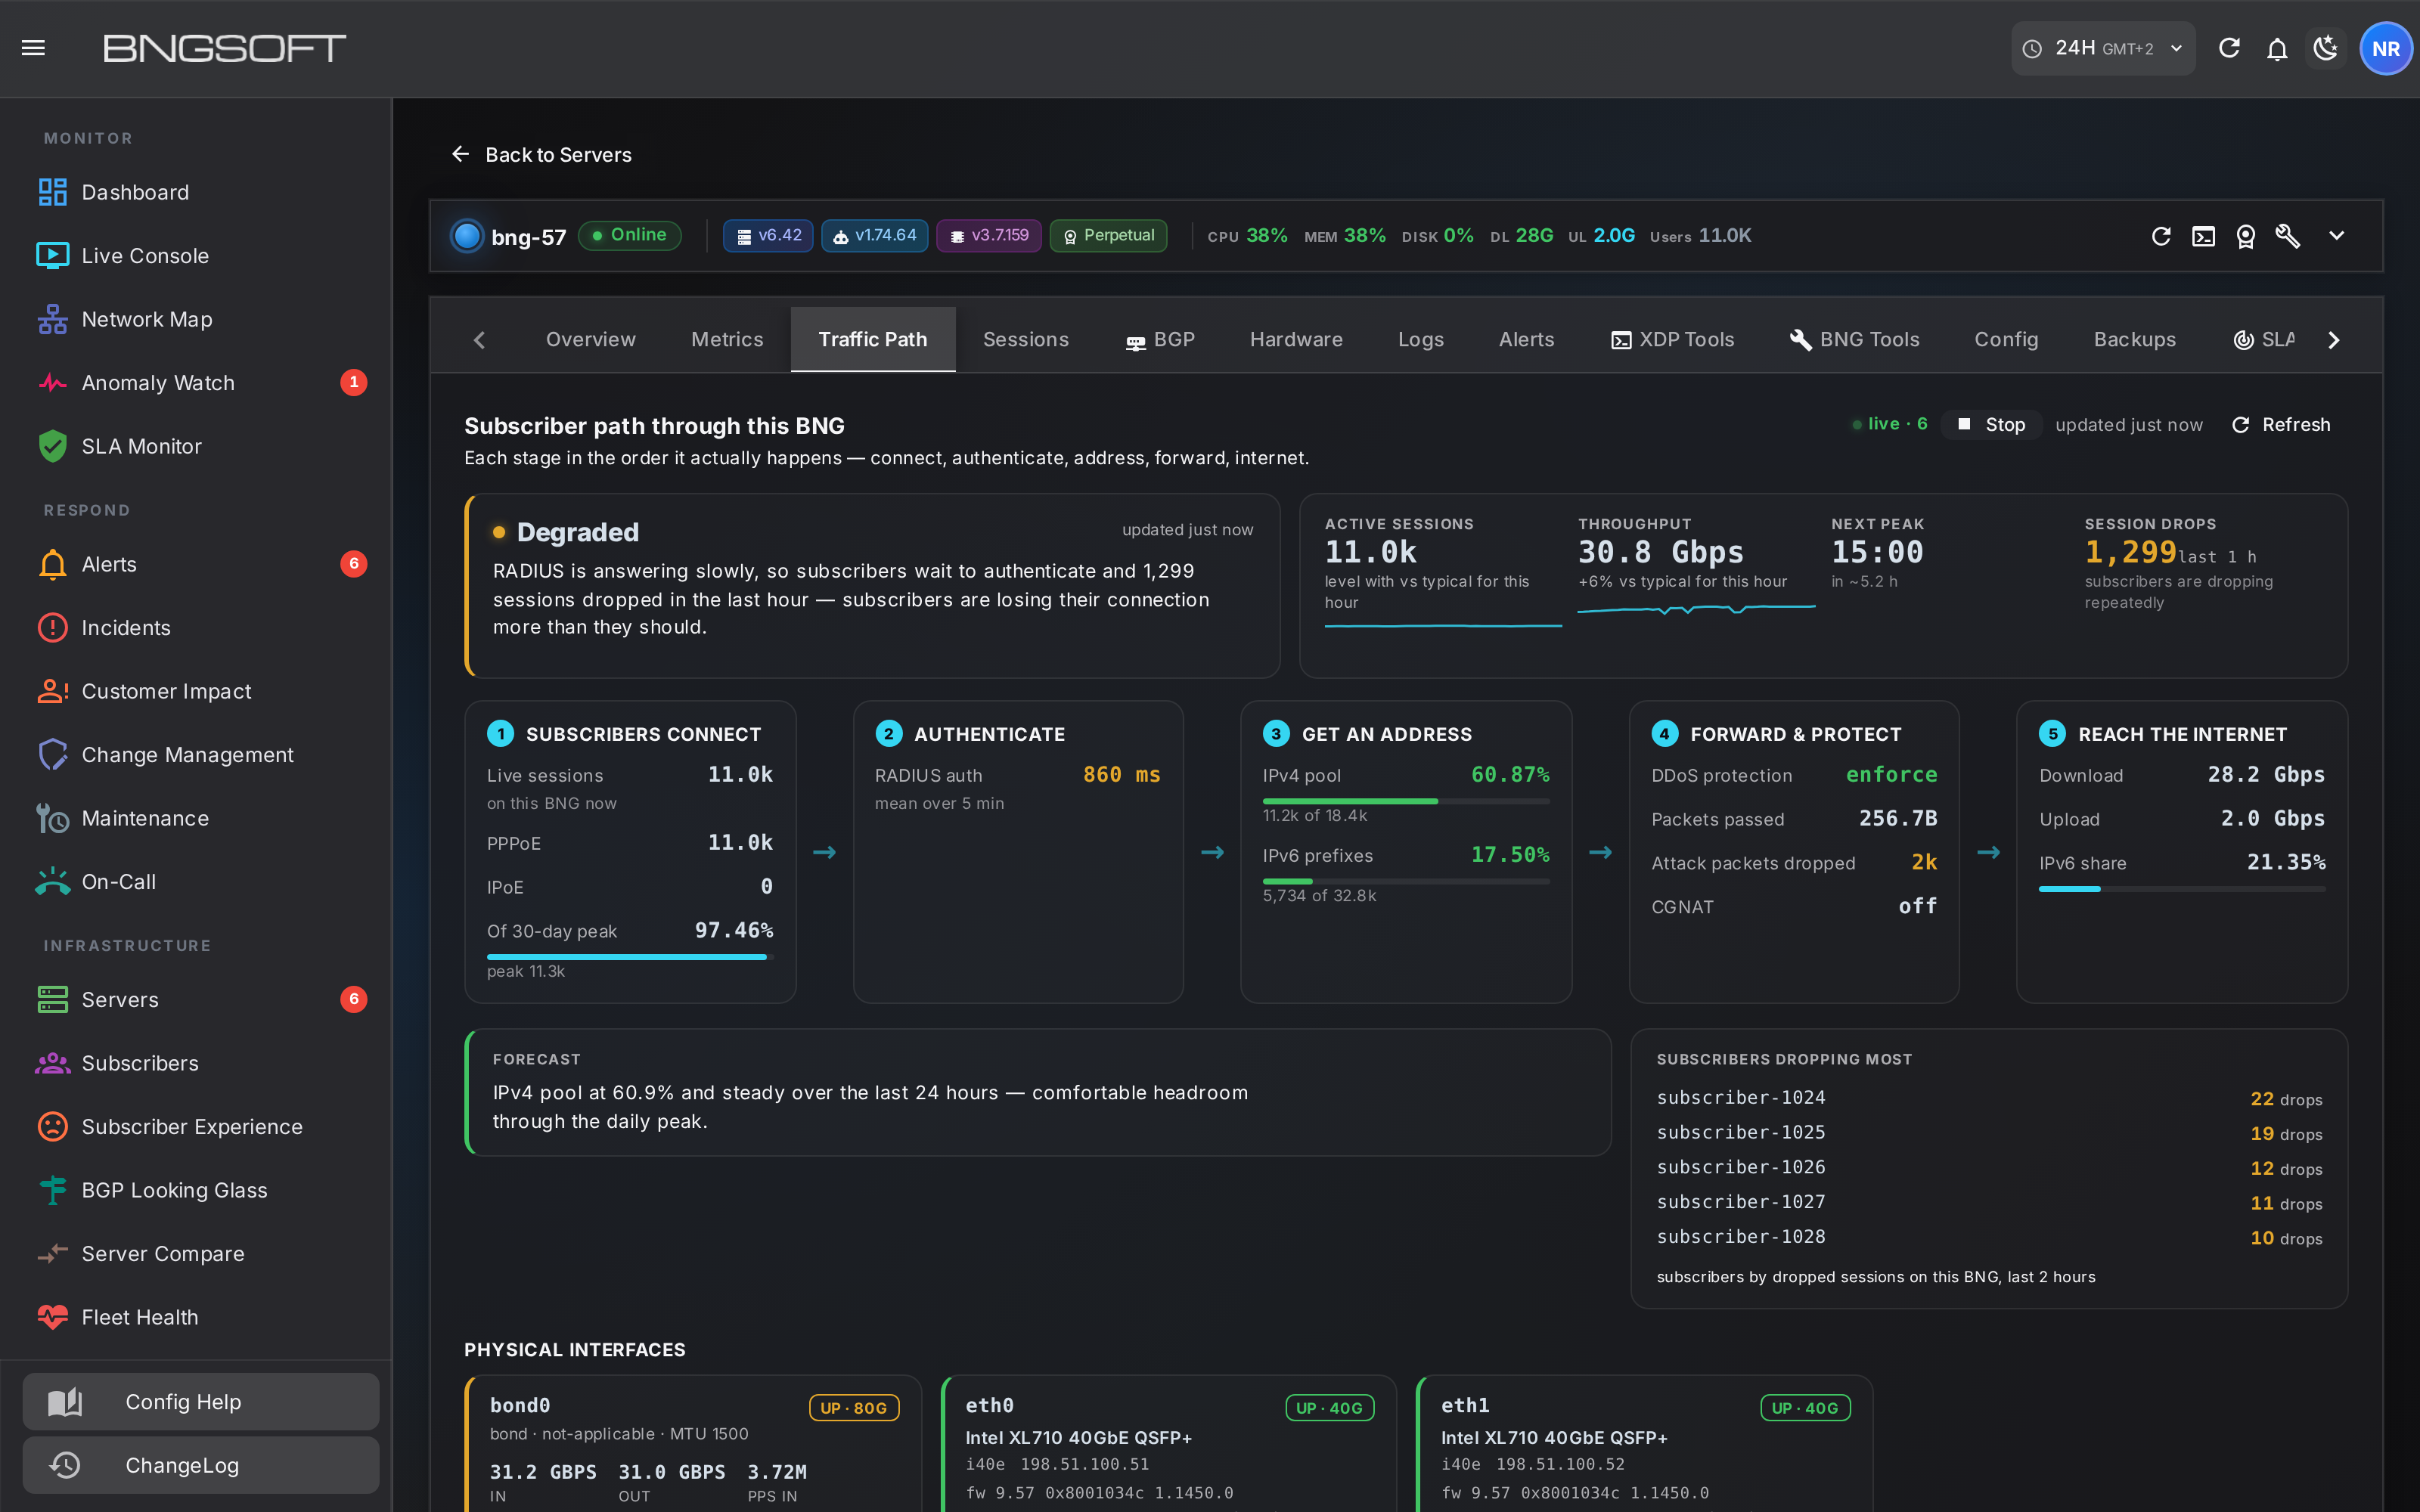
A sentence, not a colour
- "RADIUS is answering slowly, so subscribers wait to authenticate"
- Names the condition, so a first-line engineer knows what to do without escalating
Against typical, not against zero
- Same hour of day, past seven days
- The current hour is excluded, so a live event cannot quietly become its own baseline
- No baseline yet? It says so, rather than inventing one
A deadline you can act on
- Address-pool exhaustion projected from its own 24 hours
- Only speaks when the pool is genuinely climbing — a flat pool will not manufacture a scare
What it changes on a shift
- A support call arrives. Open the gateway, press Live. You are watching the box the customer is on, not a five-minute average of it. If sessions are dropping, the subscribers dropping most are listed by name.
- You make a change. Push the config, watch the effect arrive in the next five-second frame. No refreshing, no wondering whether the graph has caught up yet.
- Peak approaches. The console tells you when this gateway's peak actually is, from its own history, and whether the address pool will still have room when it gets there.
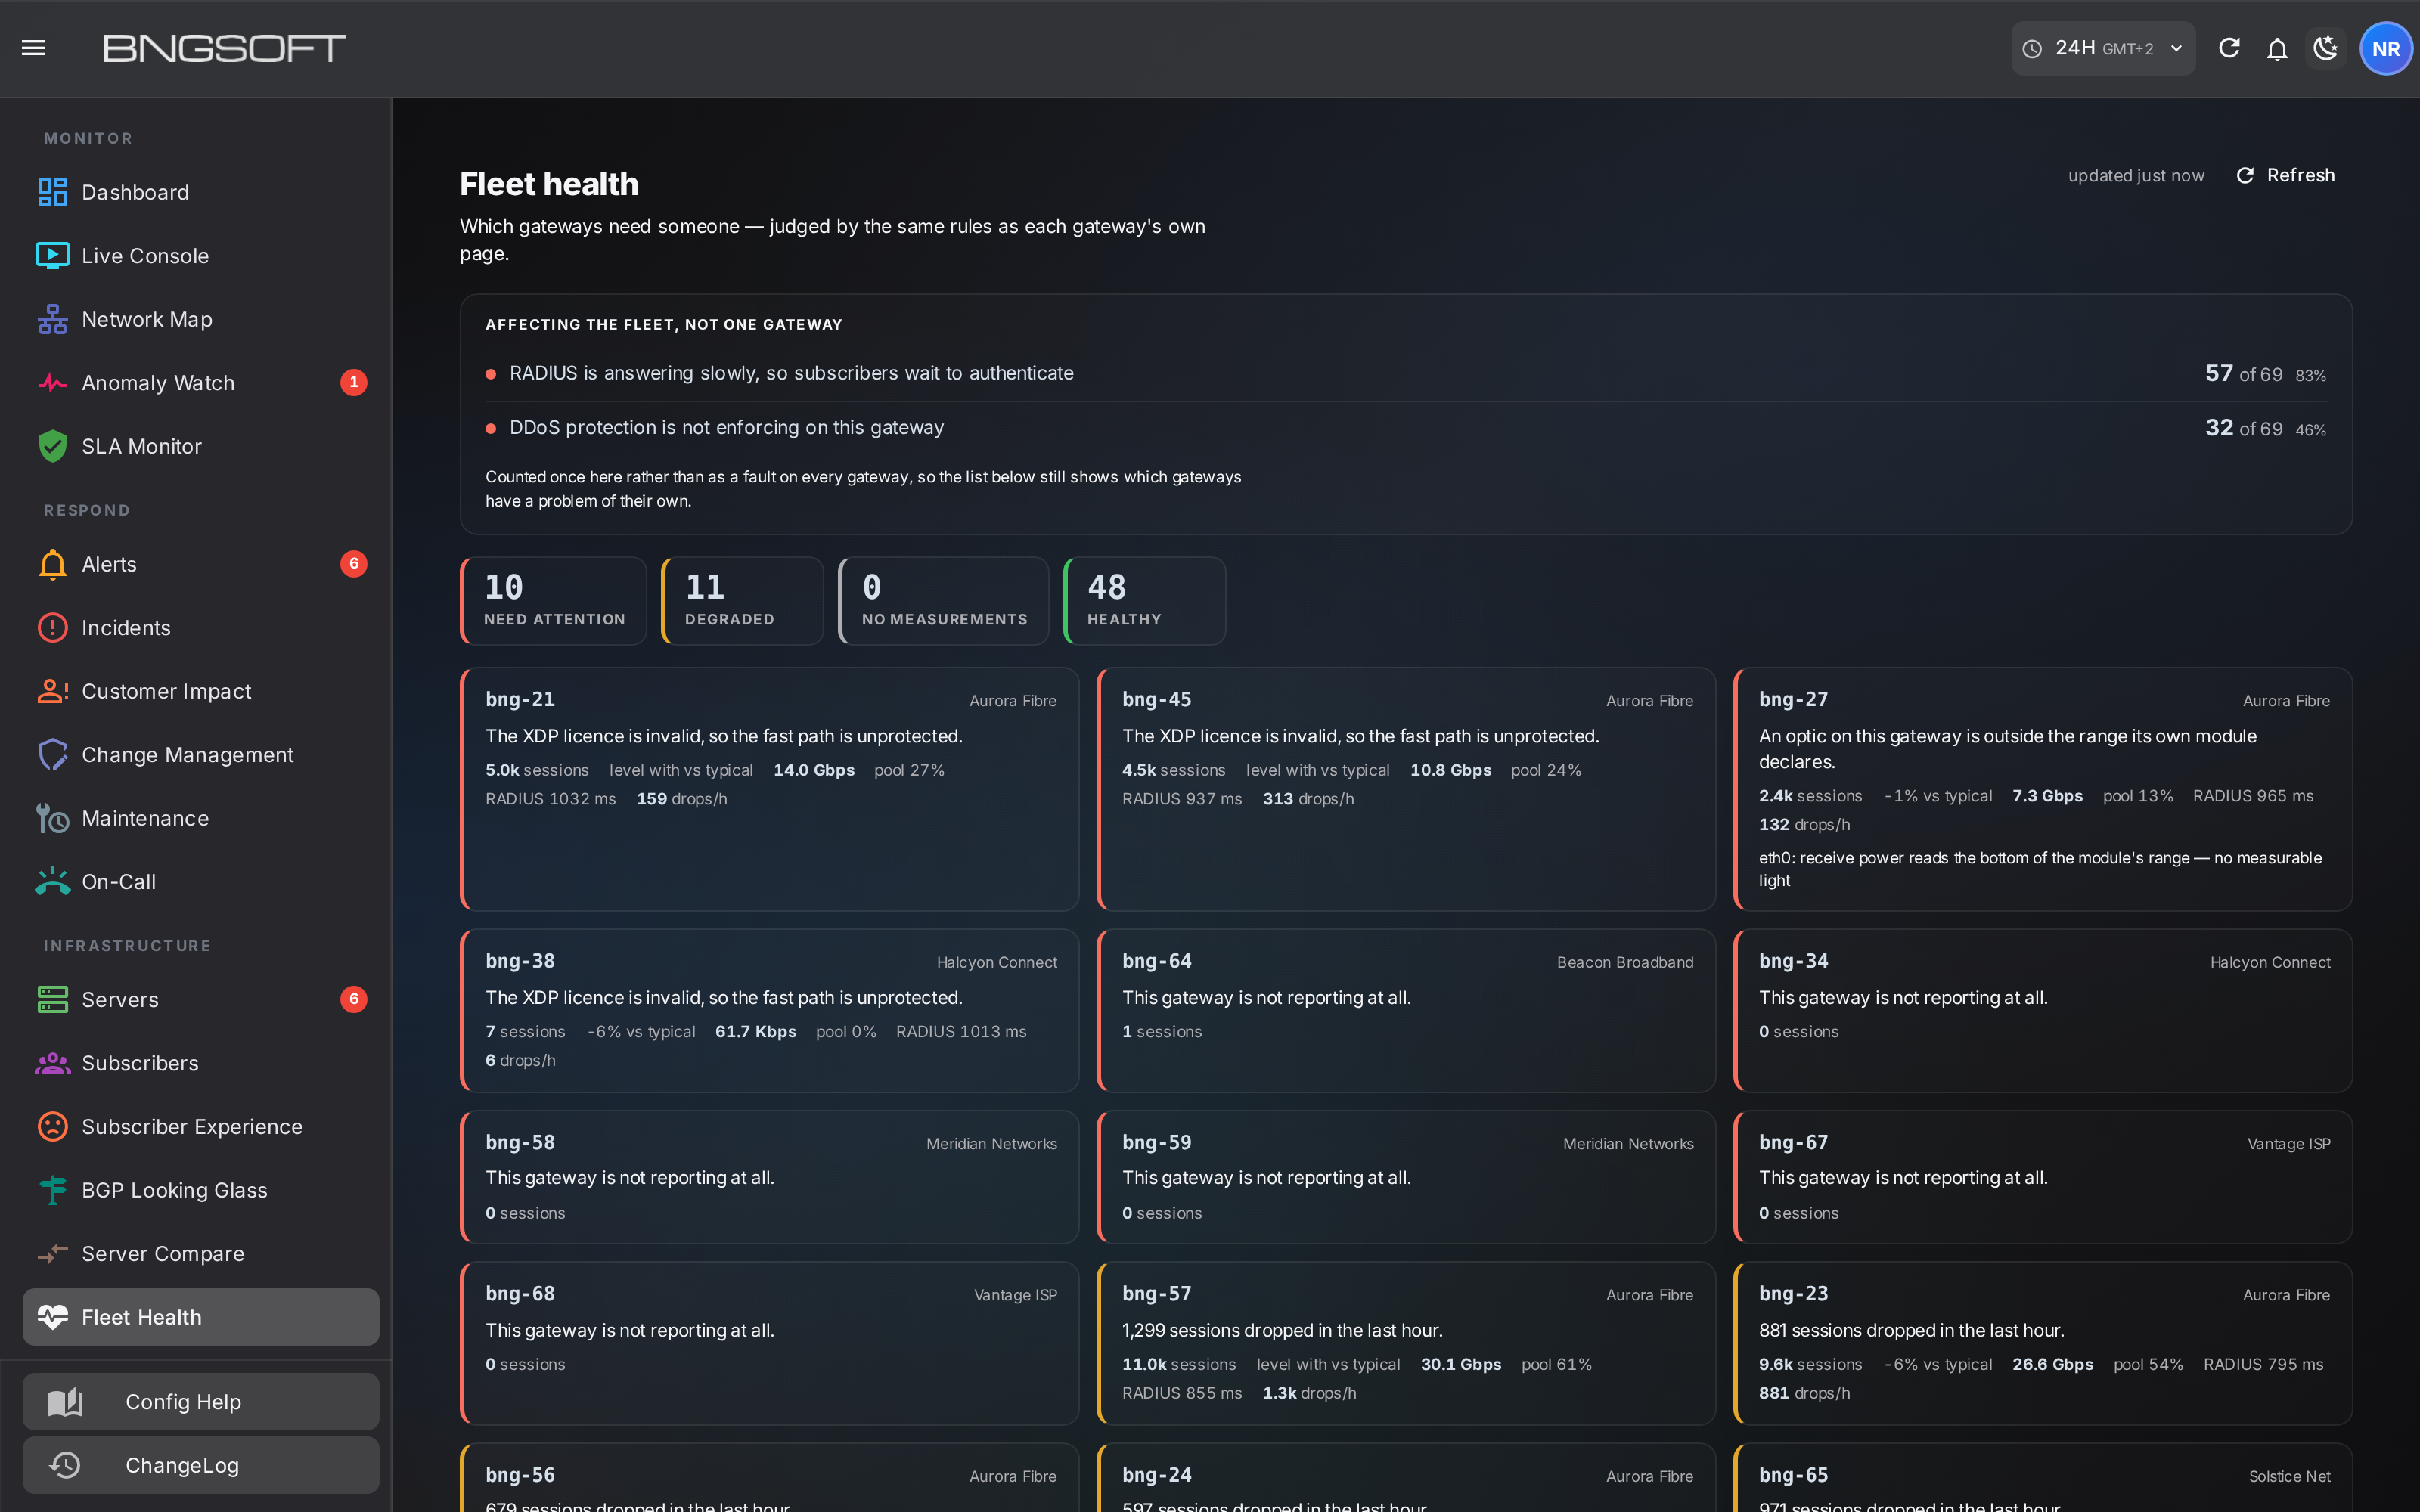
- Something is wrong estate-wide. The fleet console shows whether one gateway is misbehaving or all of them are — which is the difference between a site visit and a call to your RADIUS provider.
Honest by construction
A live view is the easiest place in a monitoring system to tell a comfortable lie: a socket that has quietly dropped still shows its last frame, and a missing metric renders as a confident zero. NOC2 is built so that cannot happen.
What a live view usually does
Holds the last value when the feed stops. Renders an unreported metric as 0. Shows a green tick for anything it did not measure. Averages a gap into the surrounding points so the line stays pretty.
What NOC2 does
Stamps every tile with its own age in seconds. Shows unmeasured as unmeasured, never as zero or as healthy. States coverage next to any derived figure. A gap in reporting is drawn as a gap, because that gap is itself the finding.
What it costs you
| Question | Answer |
|---|---|
| New software on the BNG? | None. The agent already reports; the console reads the stream it already produces. |
| Extra collector or time-series capacity? | None. Live frames are read in flight, not stored twice. |
| Load on the gateway? | Unchanged. Pressing Live does not ask the BNG for anything it was not already sending. |
| Who can see which gateways? | The same tenancy rules as the rest of NOC2. An operator streams only the gateways they are entitled to see. |
| What if a gateway stops reporting? | Its tile ages visibly and it is counted as stale. It never keeps showing a number that has stopped being true. |
Where it sits in NOC2
The Live Console is not a replacement for history, alerting or reporting — those still matter, and NOC2 does them. It exists for the minutes when history is not fast enough: a customer on the phone, a change going in, a peak approaching, an estate behaving strangely and nobody yet sure why.