
You have 69 gateways and 233,000 subscribers.
Which problem should you fix first?
NOC2 watches every BNG you run, and answers that question in the only terms that matter to an ISP: how many customers are affected, how long it has been true, and what you should do about it. This is what it monitors, how it works, and what it changes about a working day.
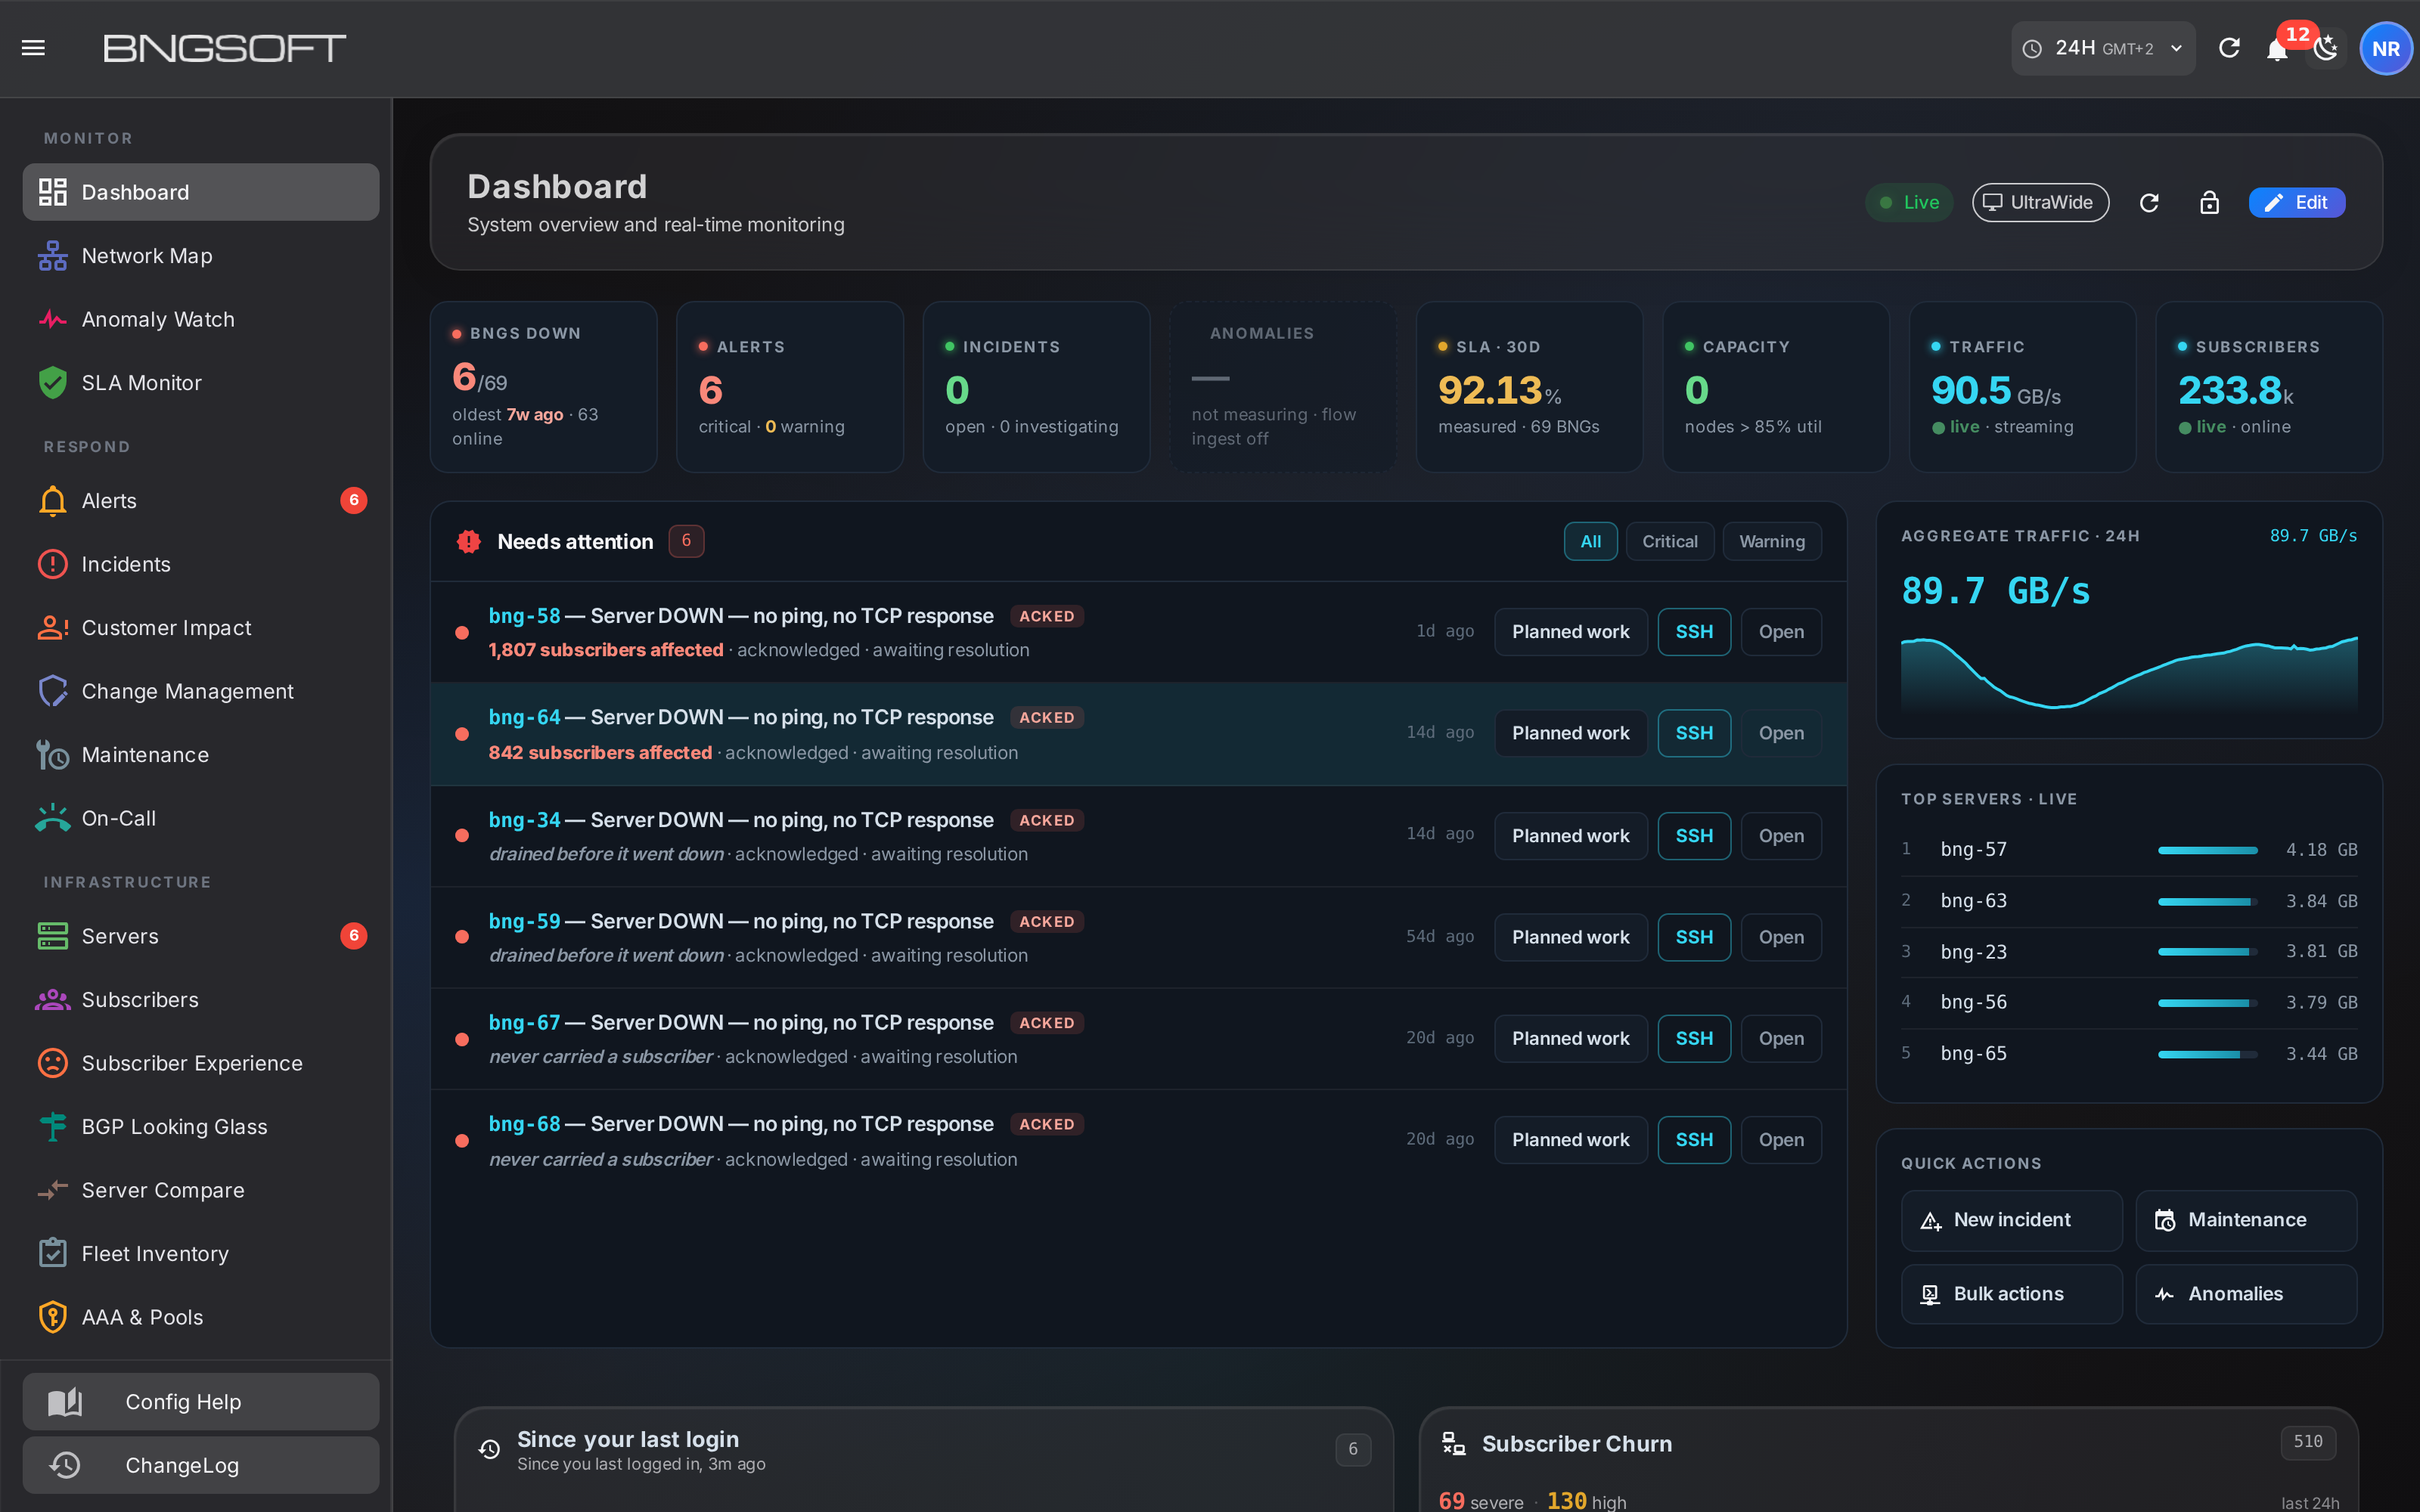
Most monitoring tells you a server is down. That is rarely the hard part. The hard part is that six alerts are open, two of them are gateways nobody has ever connected to, one was drained on purpose last month, and one is carrying 1,807 live customers right now — and every one of them looks identical on the screen.
How it works
One agent per gateway, one place to look. There is nothing to mirror, no span port to provision, and no separate collector estate to run.
Nothing in the traffic path
The agent observes. It is not inline, it does not proxy subscriber traffic, and if it stops the gateway keeps forwarding exactly as before.
Multi-tenant from the ground up
Every query is scoped to the gateways a user may see. A reseller or downstream operator logs into the same platform and sees only their own estate.
Works with what you run
Built for BNGSOFT gateways on commodity servers, and equally happy watching a mixed estate. Nothing here assumes a particular vendor's chassis.
What it changes: six questions, answered
1 · What is actually broken?
Every alert carries the number of subscribers it affects, and the list is ordered by that number rather than by age. The same query separates a genuine outage from a gateway that was drained before it was retired, and from one that has never carried a single session — three things that look identical in a conventional alert list and need three completely different responses.
2 · Is it them, their line, or us?
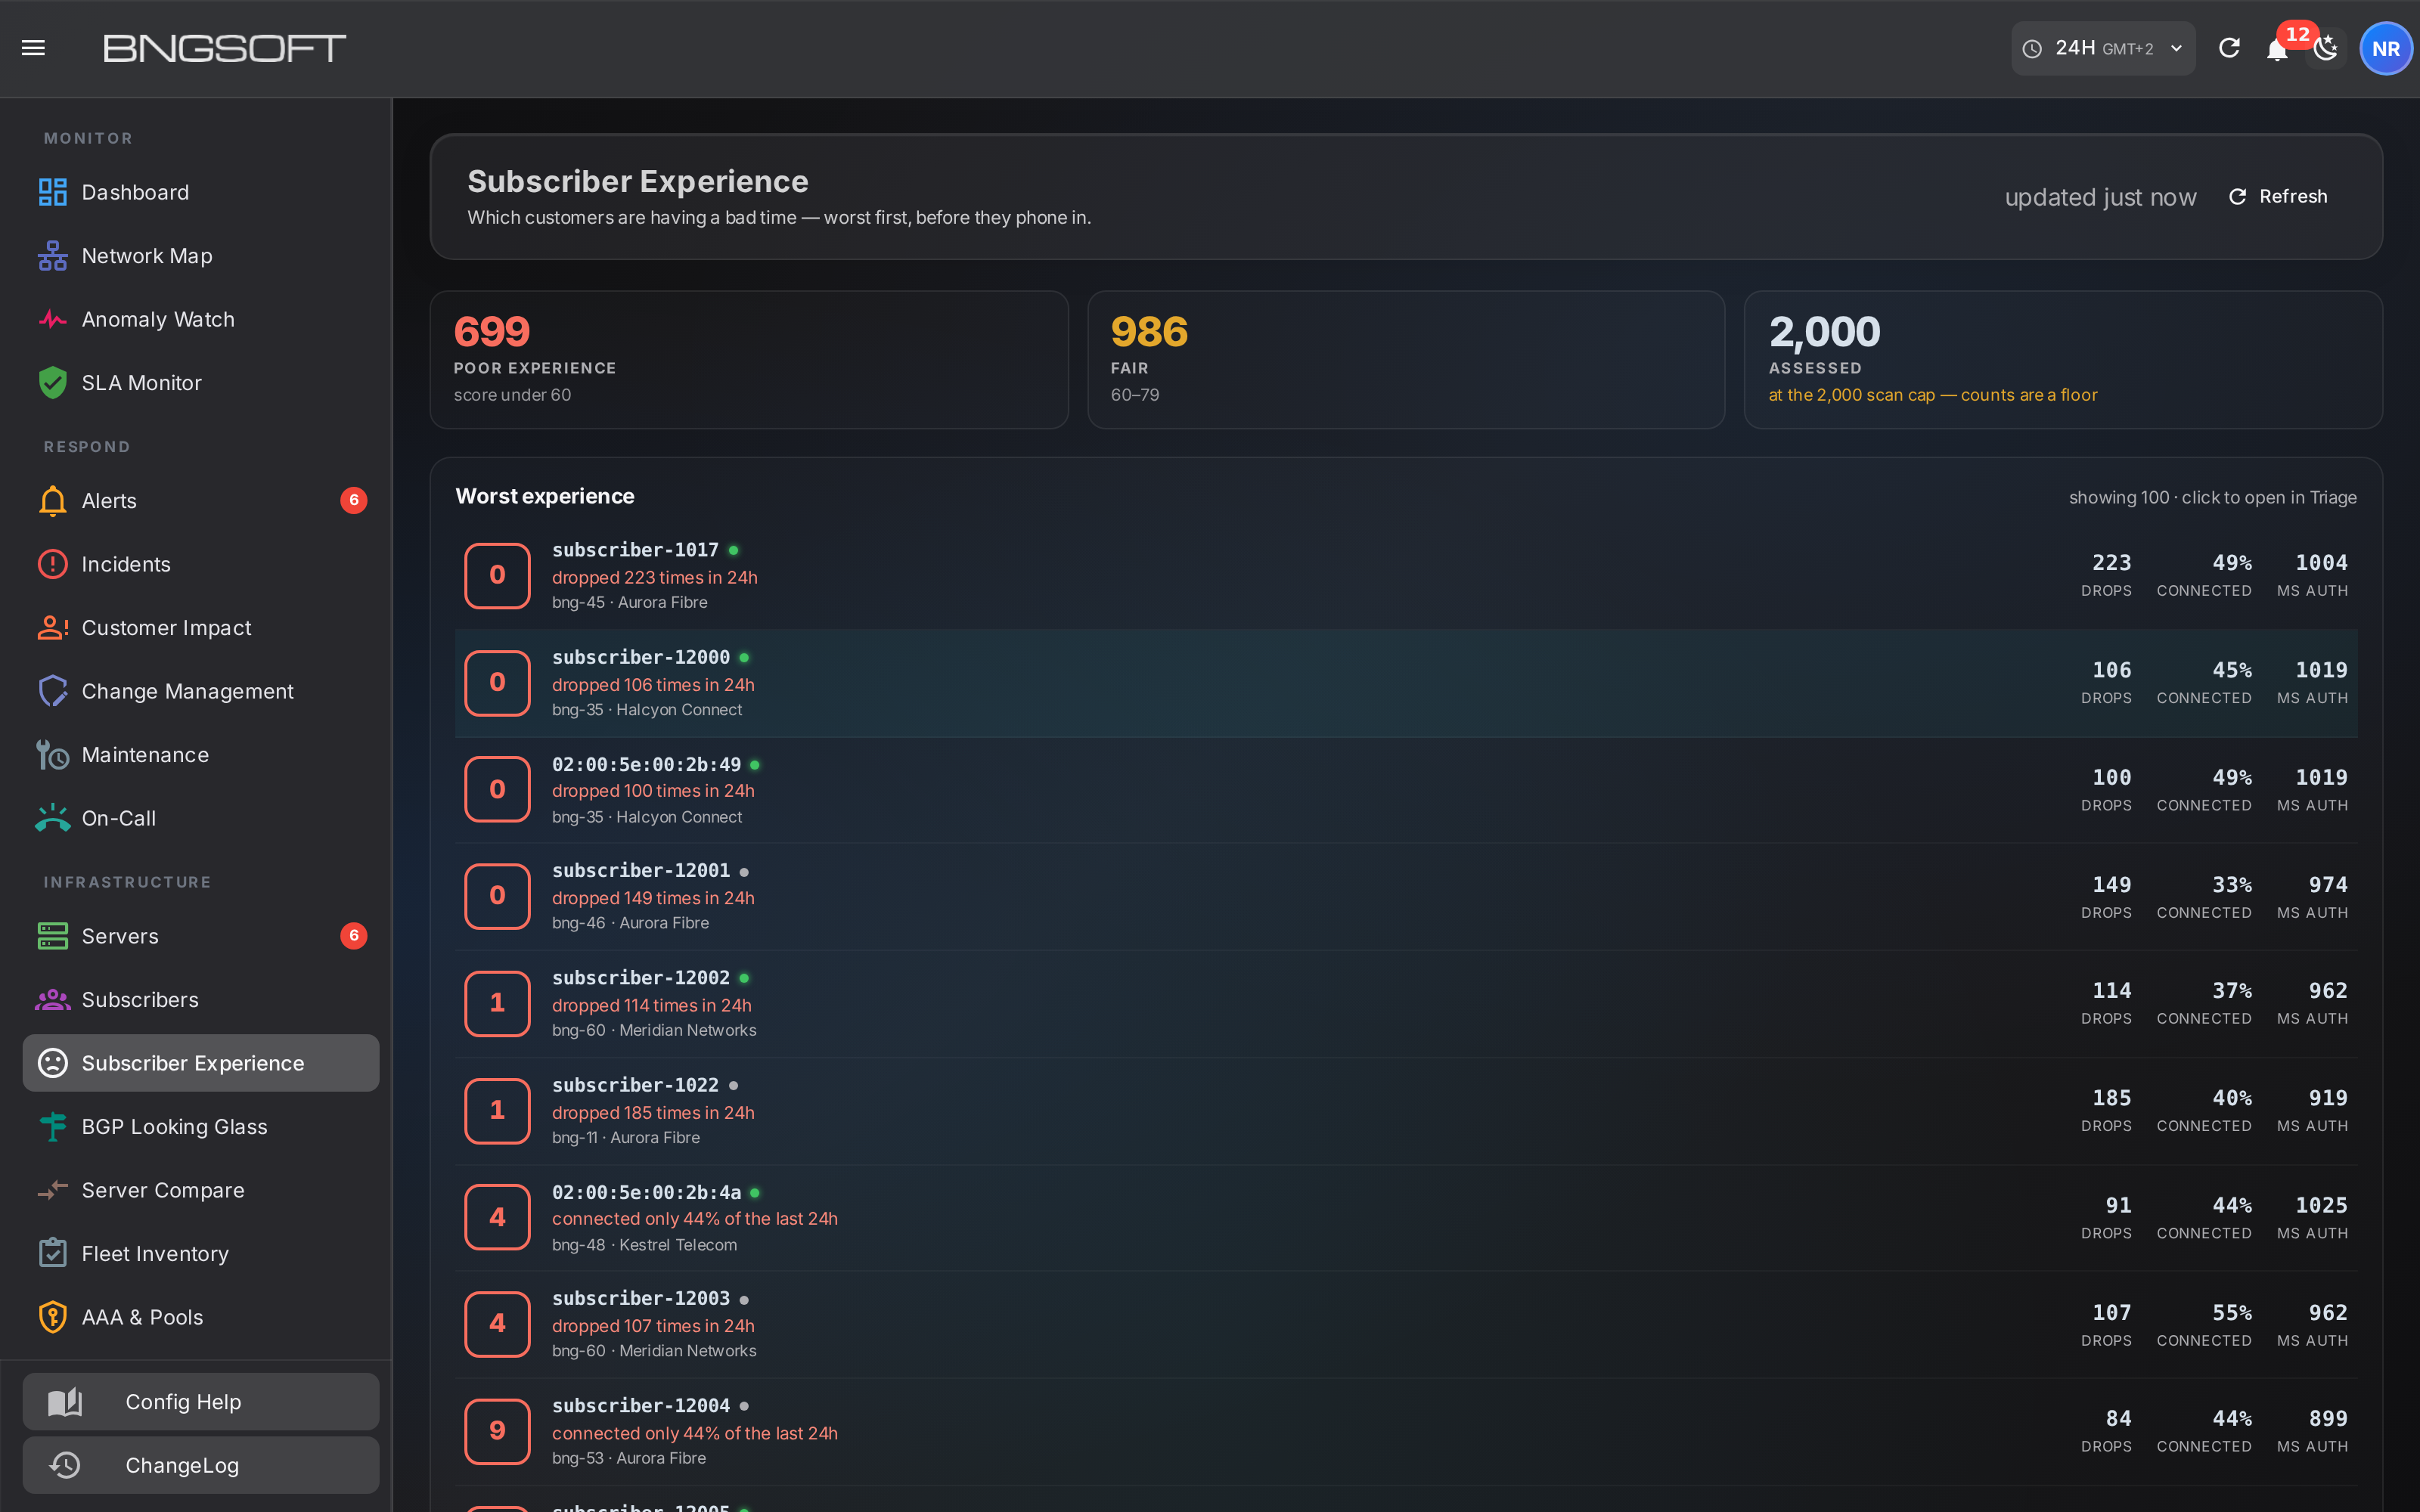
The support desk gets a per-subscriber quality score built from how often the session drops, how much of the day the subscriber was actually connected, and how slowly authentication is answering on their gateway. Worst first, so the desk can call a customer before the customer calls in — and each row says which of the three is the problem rather than restating the score.
3 · Is authentication healthy?
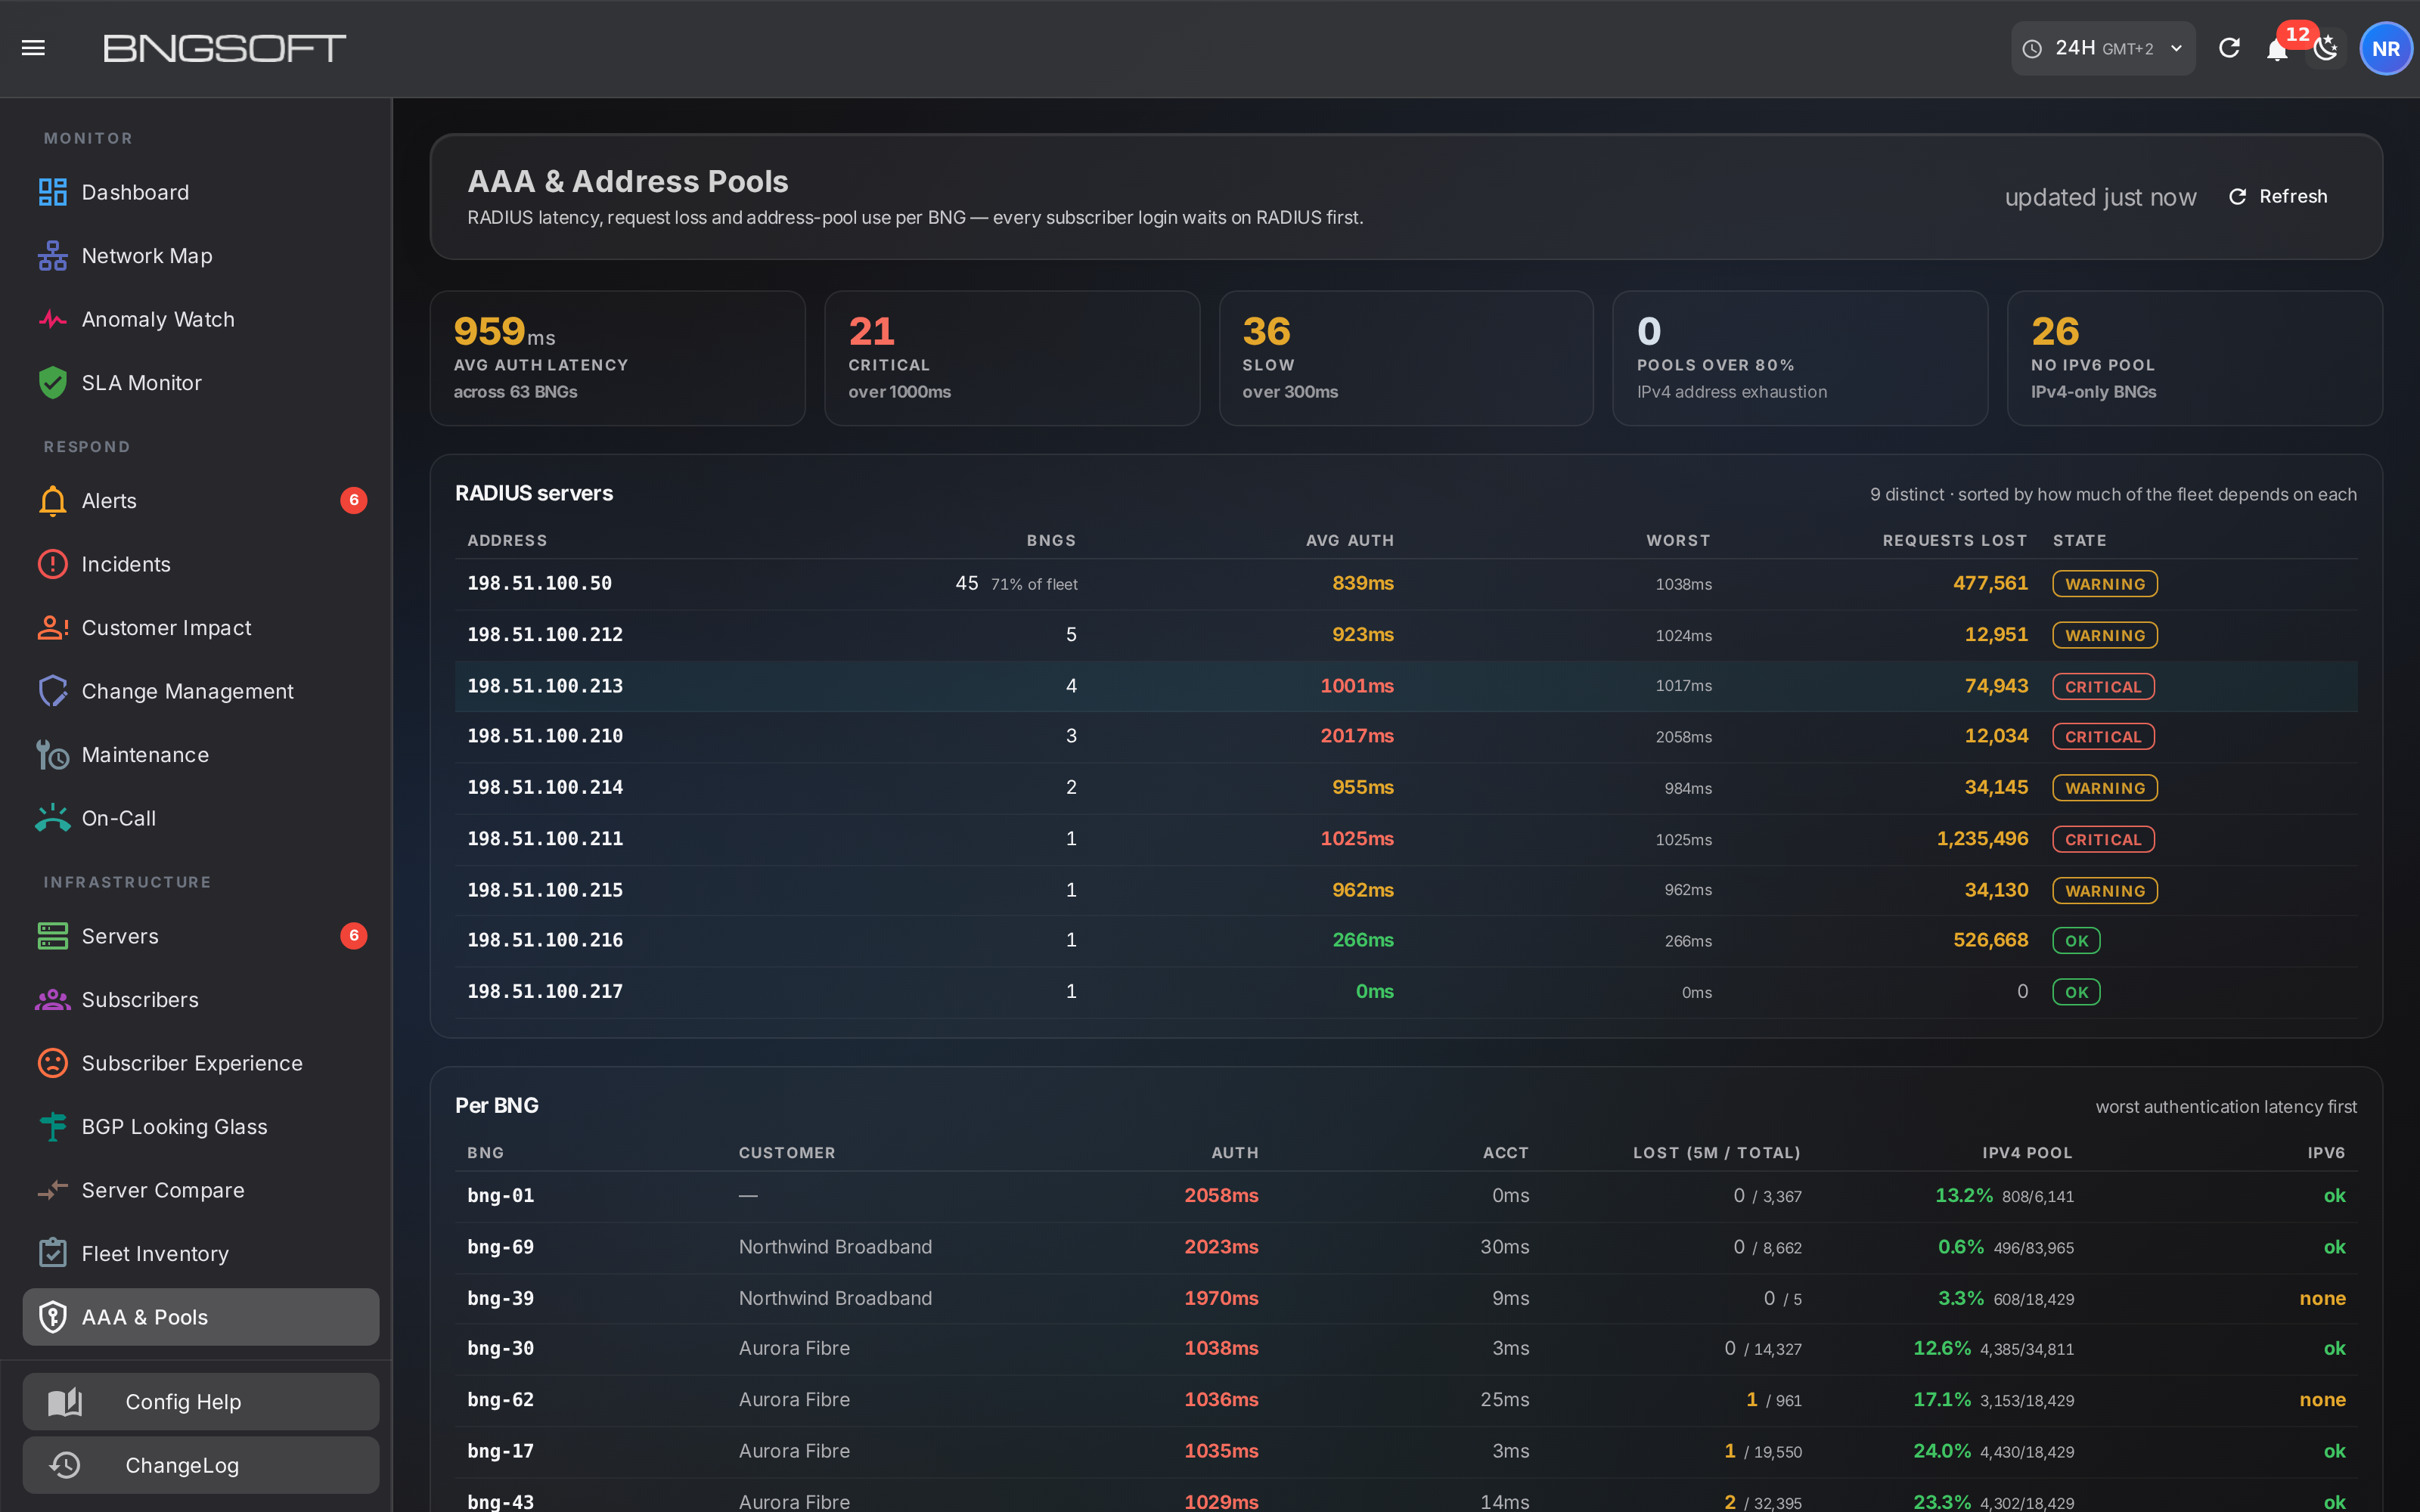
RADIUS sits in front of every single login. NOC2 records authentication latency, request loss and queue depth per gateway, then rolls it up per RADIUS server so you can see how much of the estate depends on one box. On the estate below, one server answers for 71% of the gateways.
4 · Are we absorbing an attack?
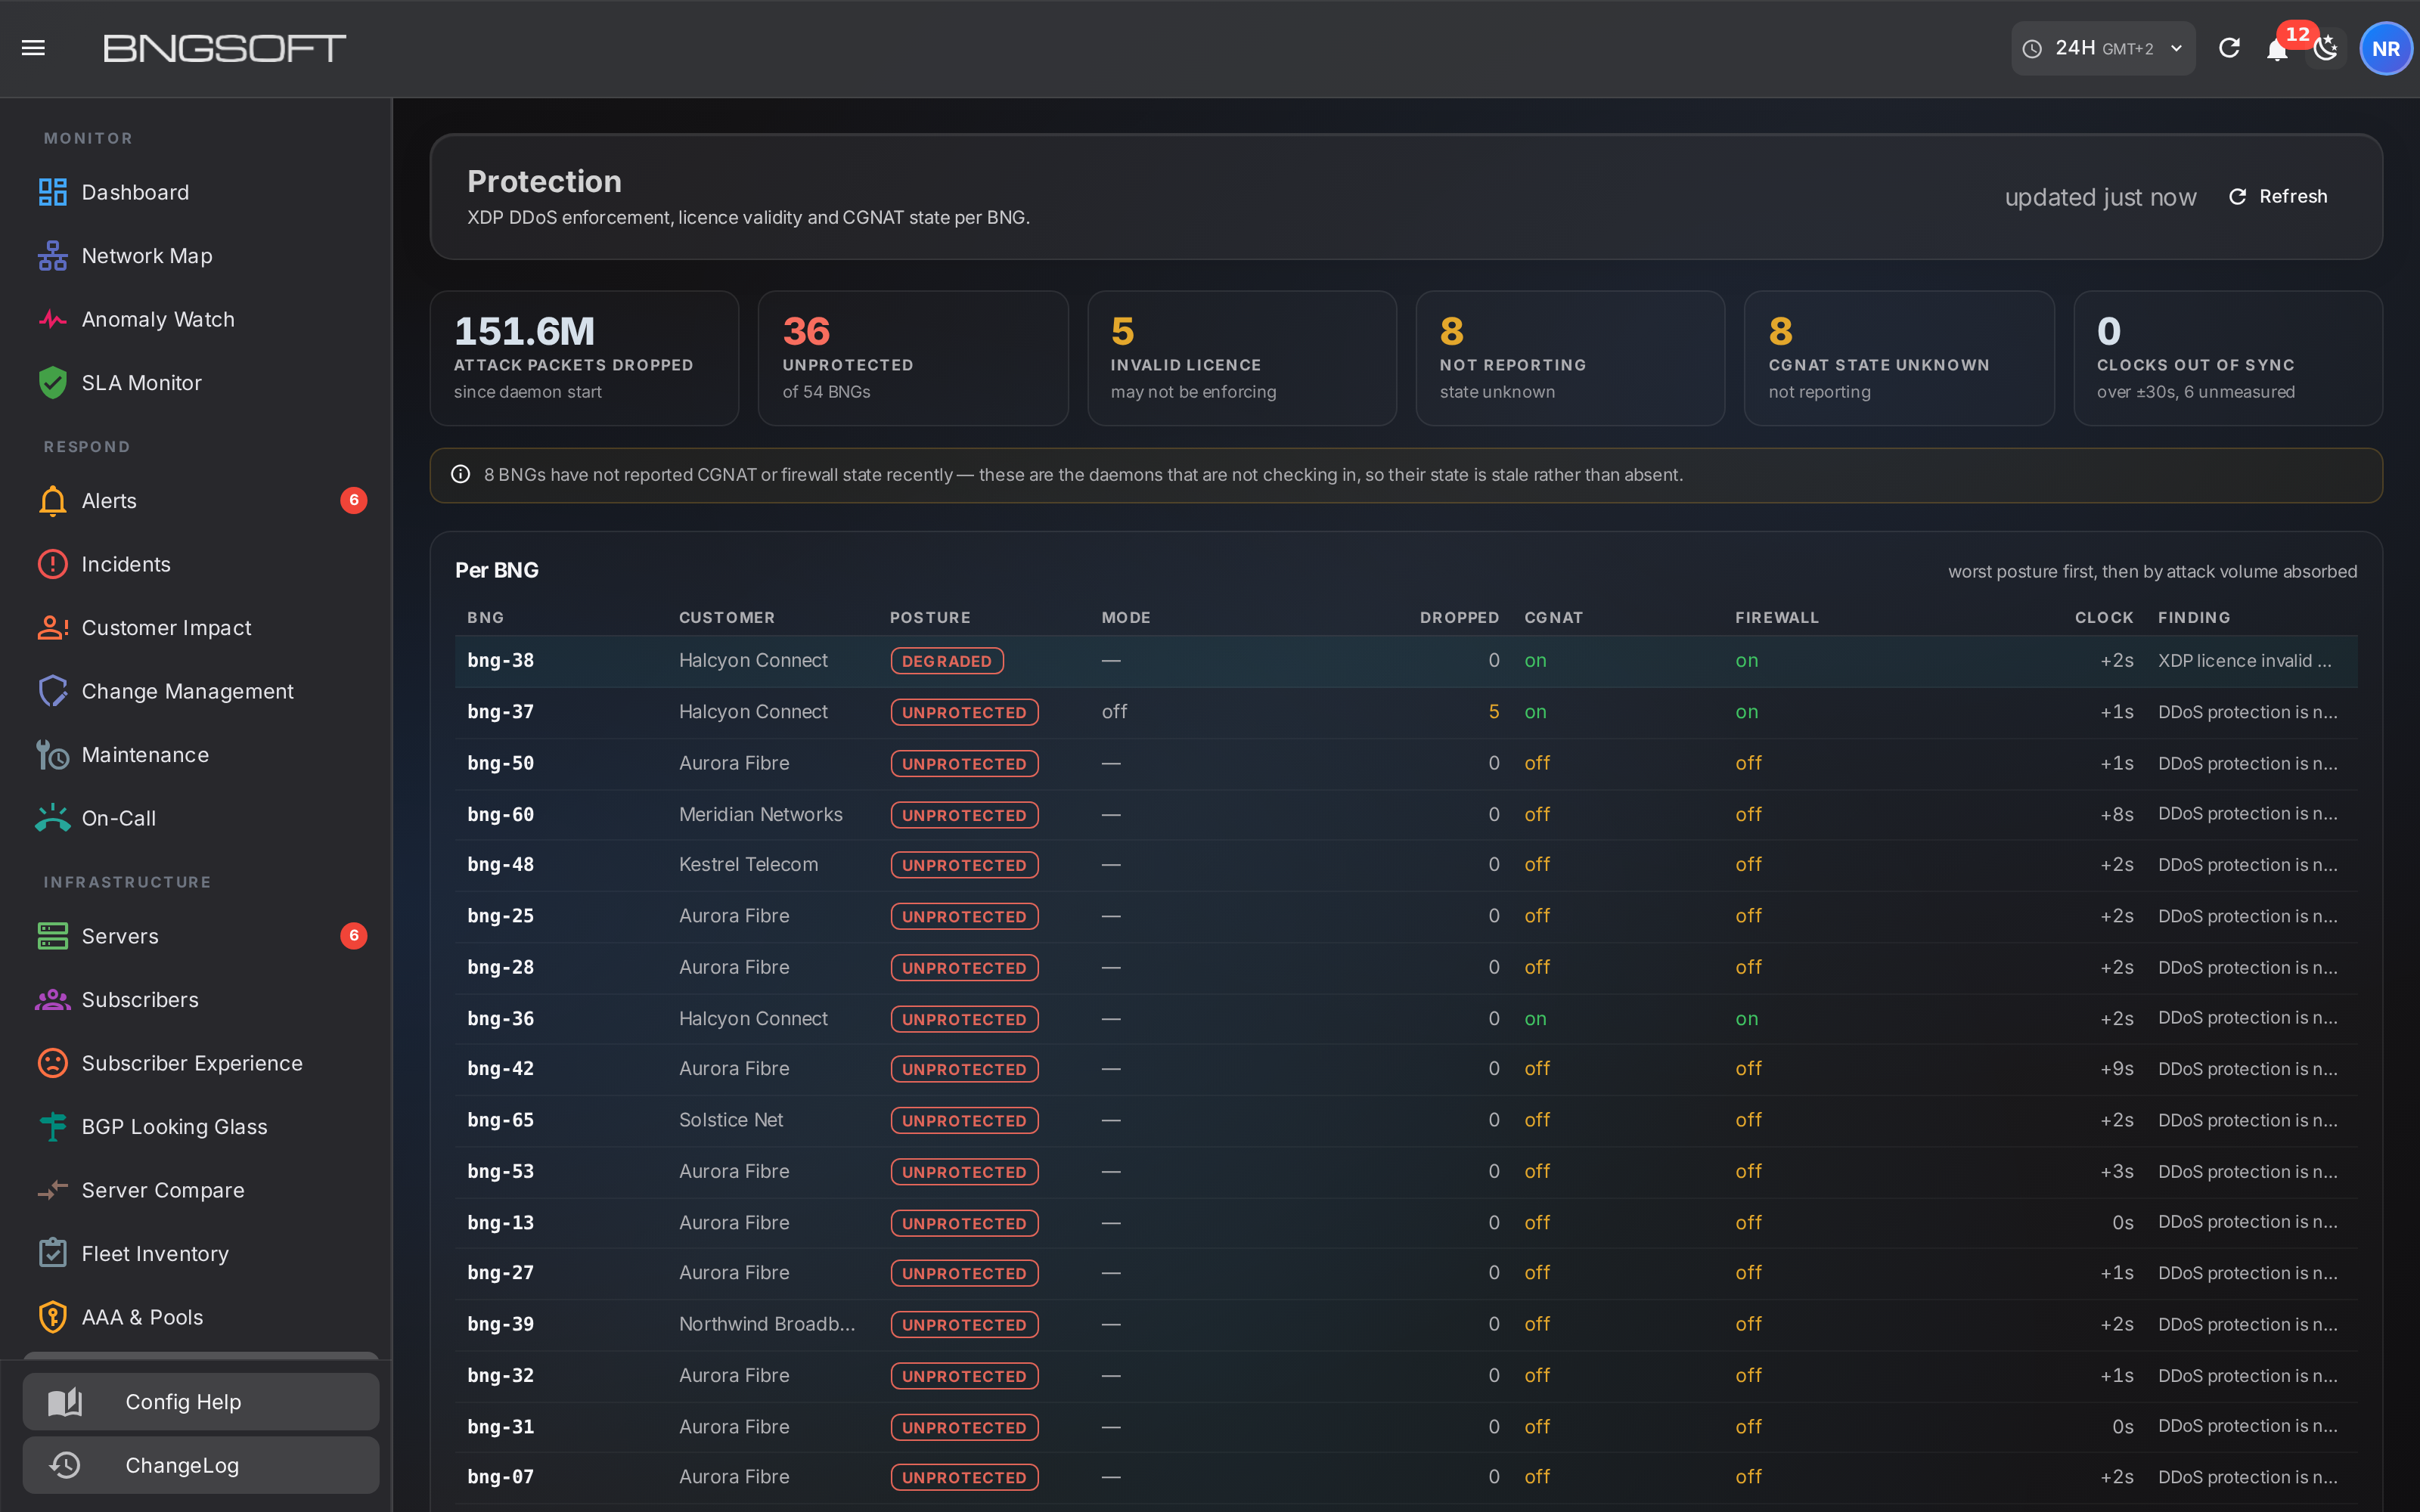
XDP protection state, enforcement mode and dropped-packet counters, per gateway. Attack traffic that is being silently absorbed becomes visible, and so does the opposite problem: gateways where protection is switched off or the licence has lapsed.
5 · When do we run out?
Capacity forecasting that needs no configuration. Rather than asking you to declare a session ceiling per gateway — a form nobody fills in — NOC2 fits the measured CPU and memory trend and projects when each gateway crosses a danger threshold. Gateways with a flat, falling or too-noisy trend produce no date at all, because a confident wrong date is worse than none.
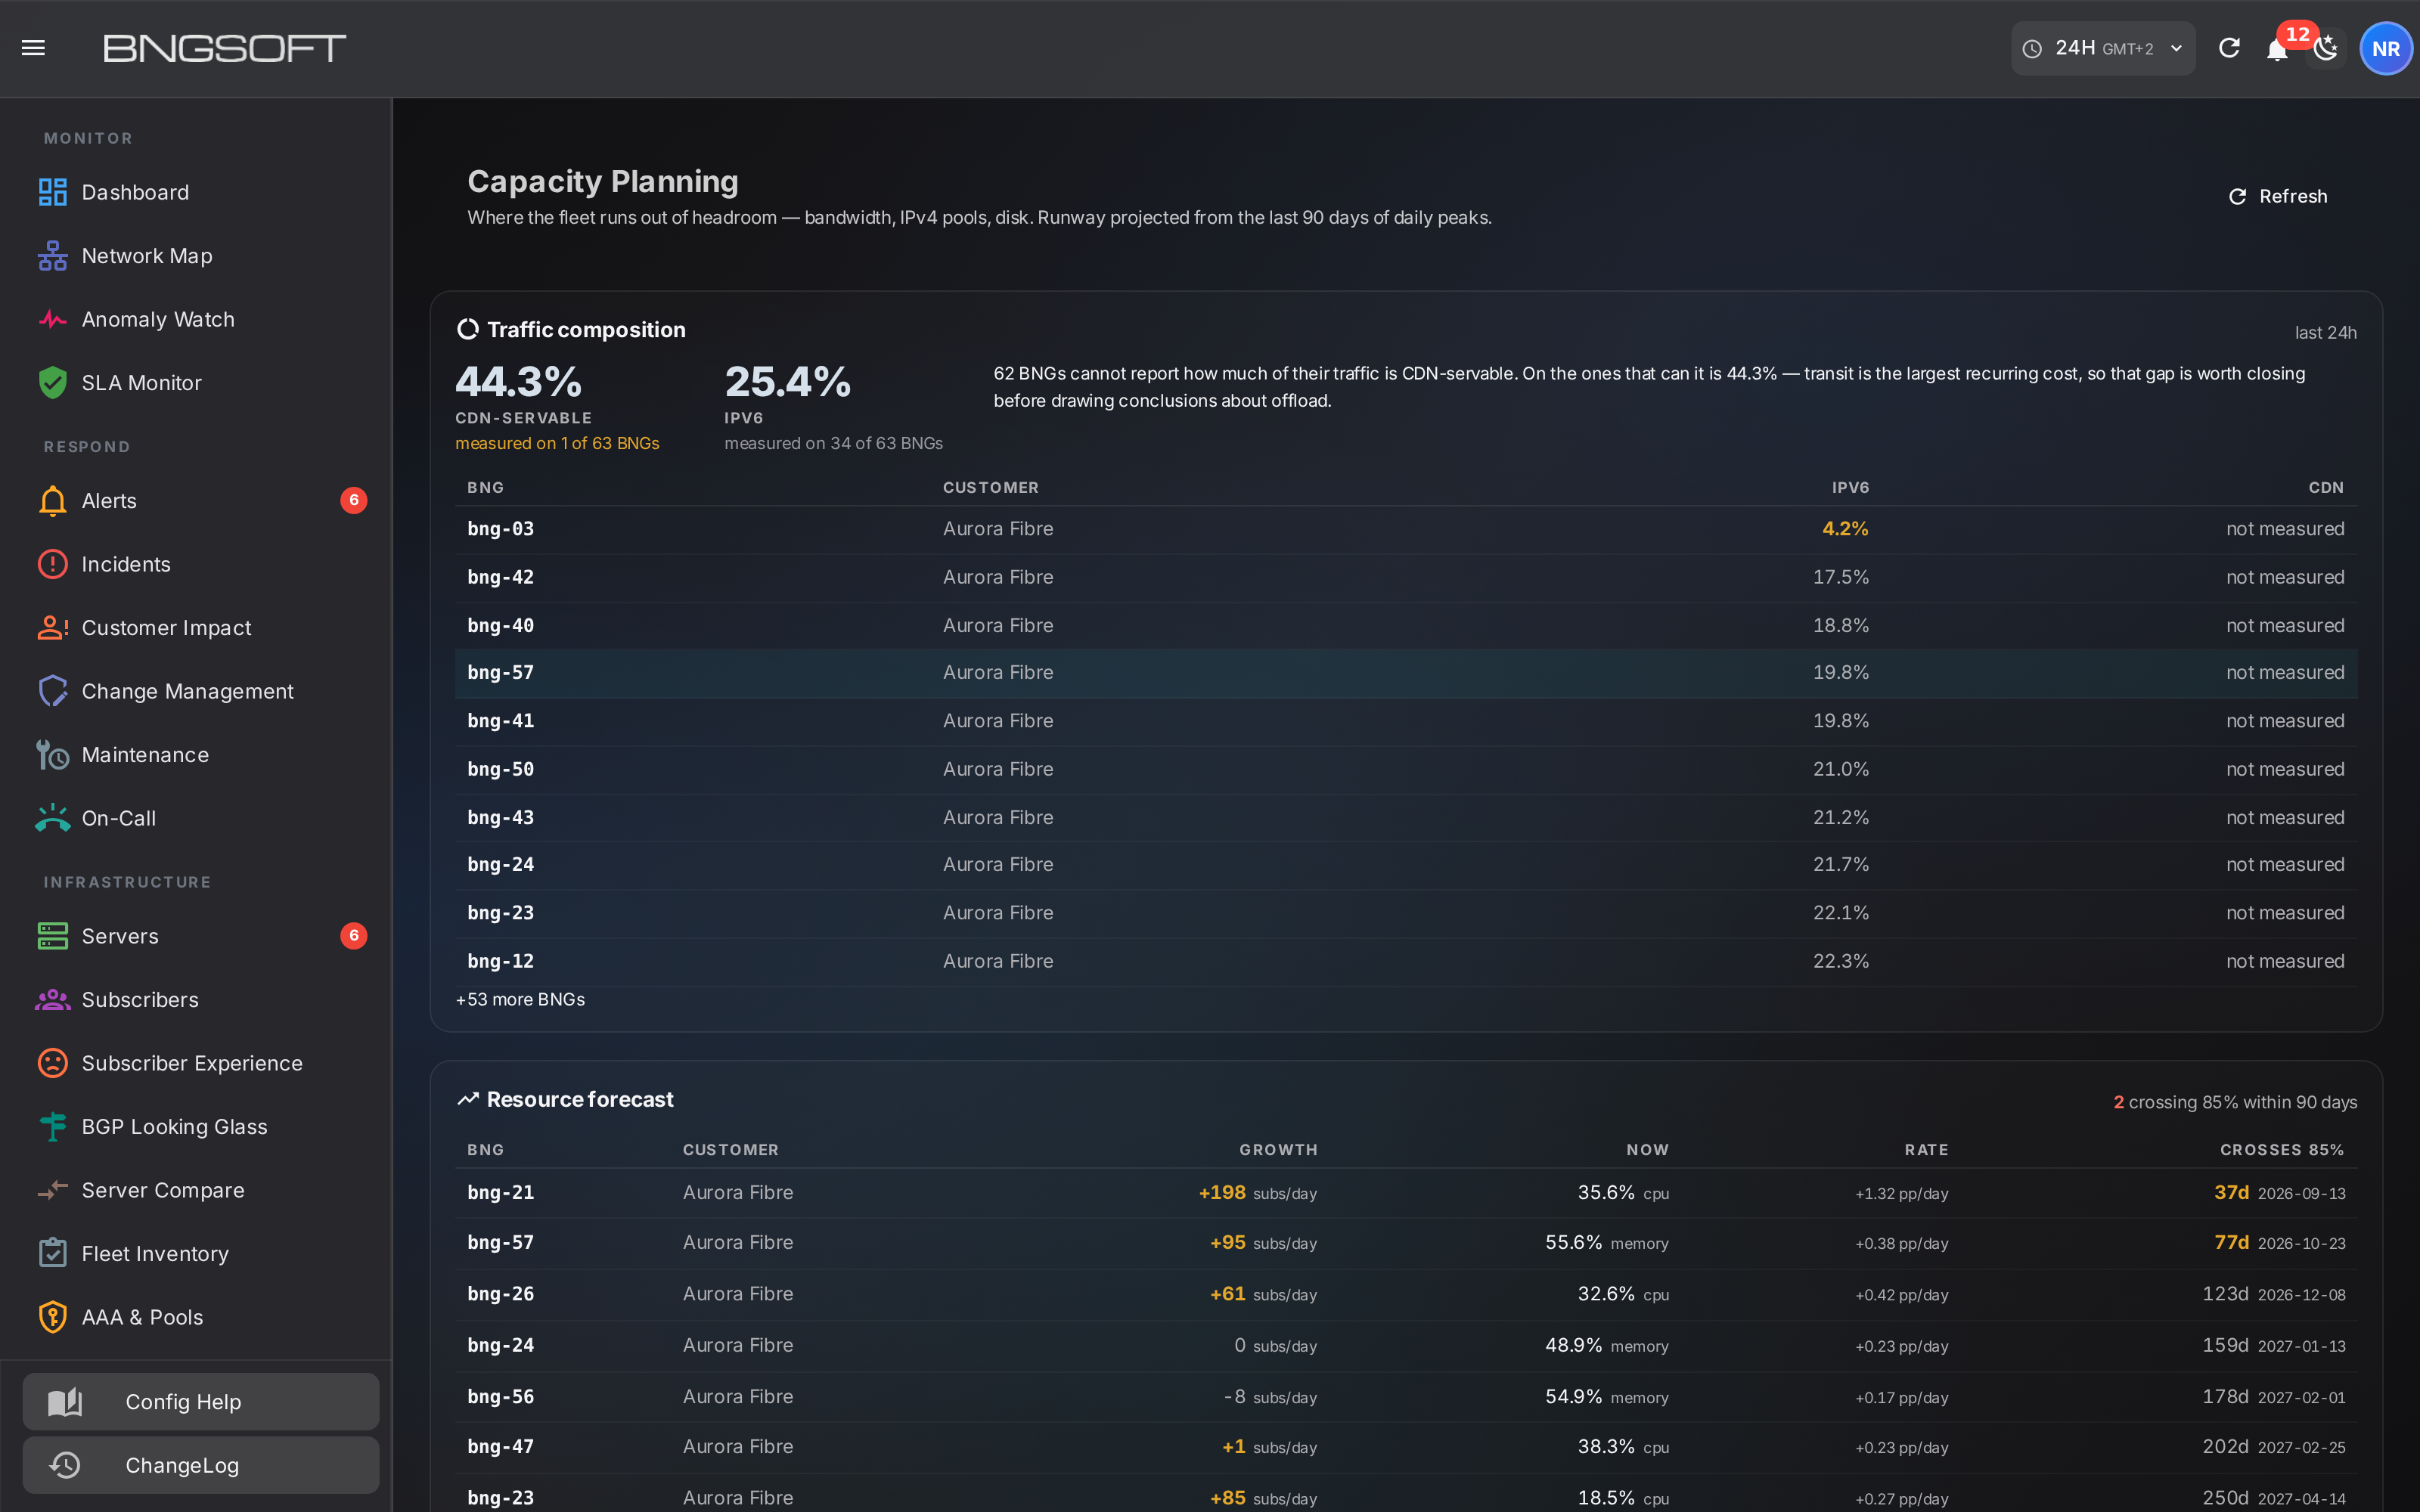
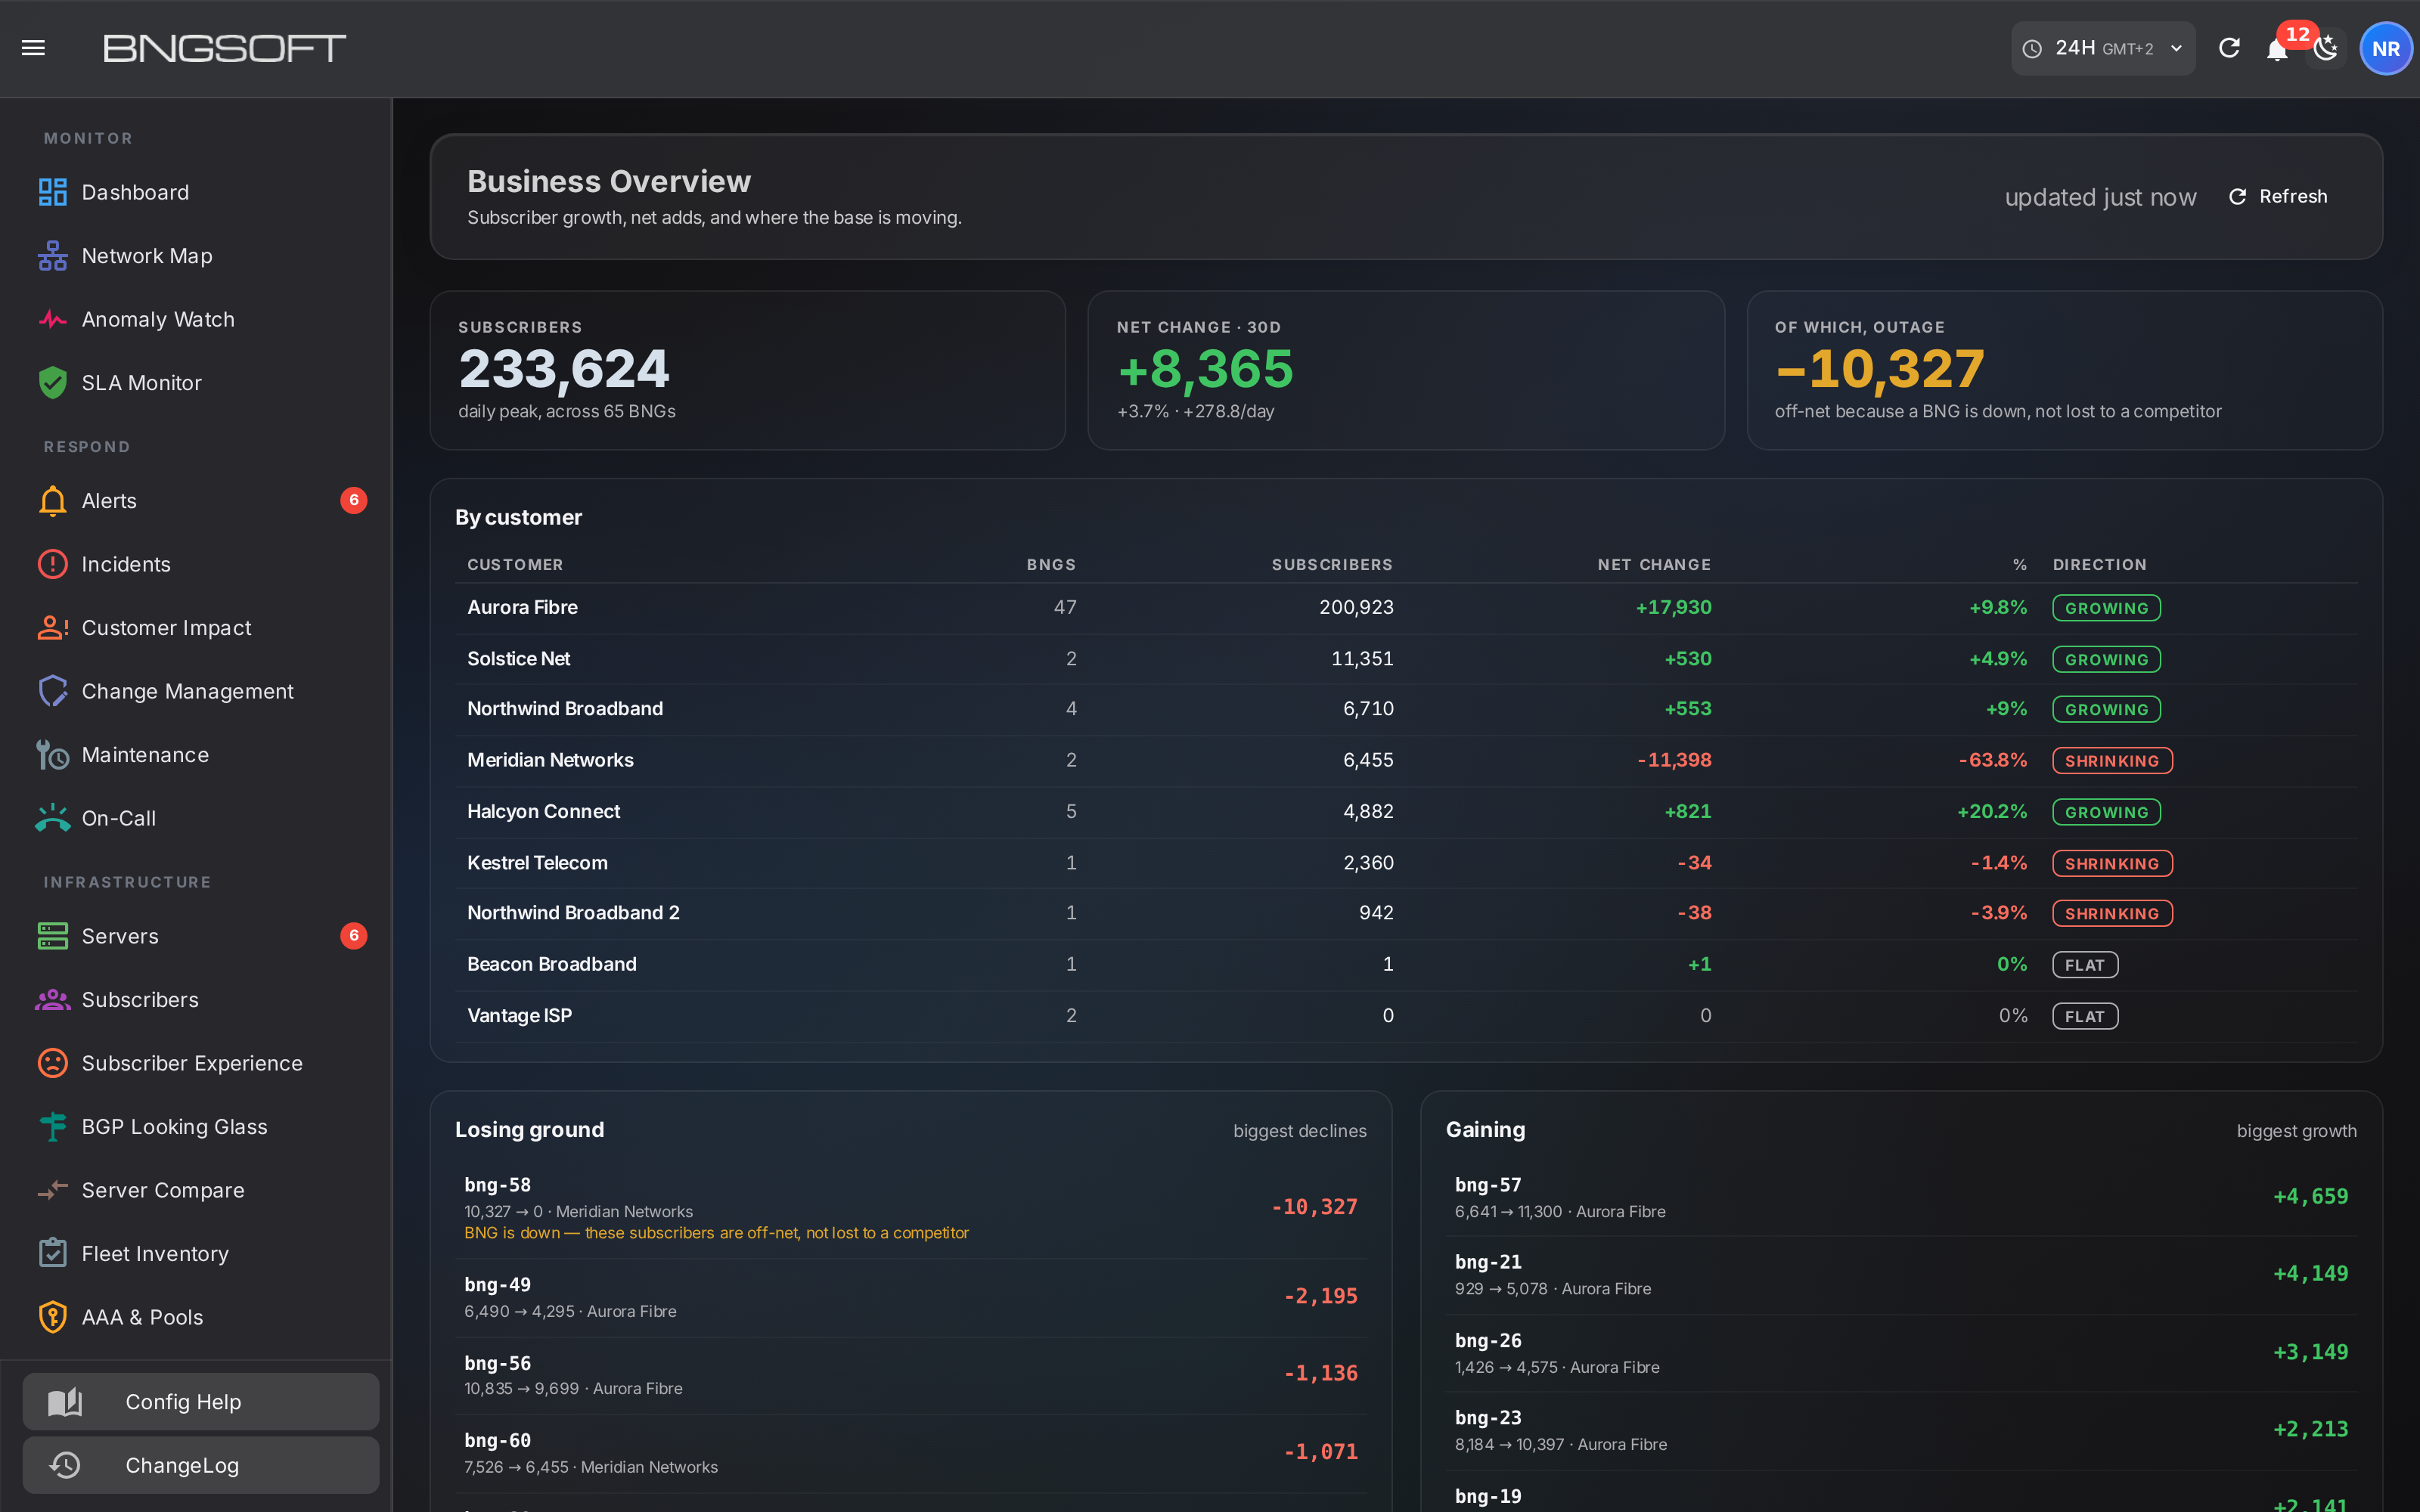
6 · How is the business doing?
Subscriber growth and net adds measured on the daily peak per gateway, so the hour of day cannot masquerade as growth. Gateways that are losing ground are separated from gateways that are simply down — an outage and a departing customer are not the same commercial event, and only one of them needs a salesperson.
Inside a single gateway
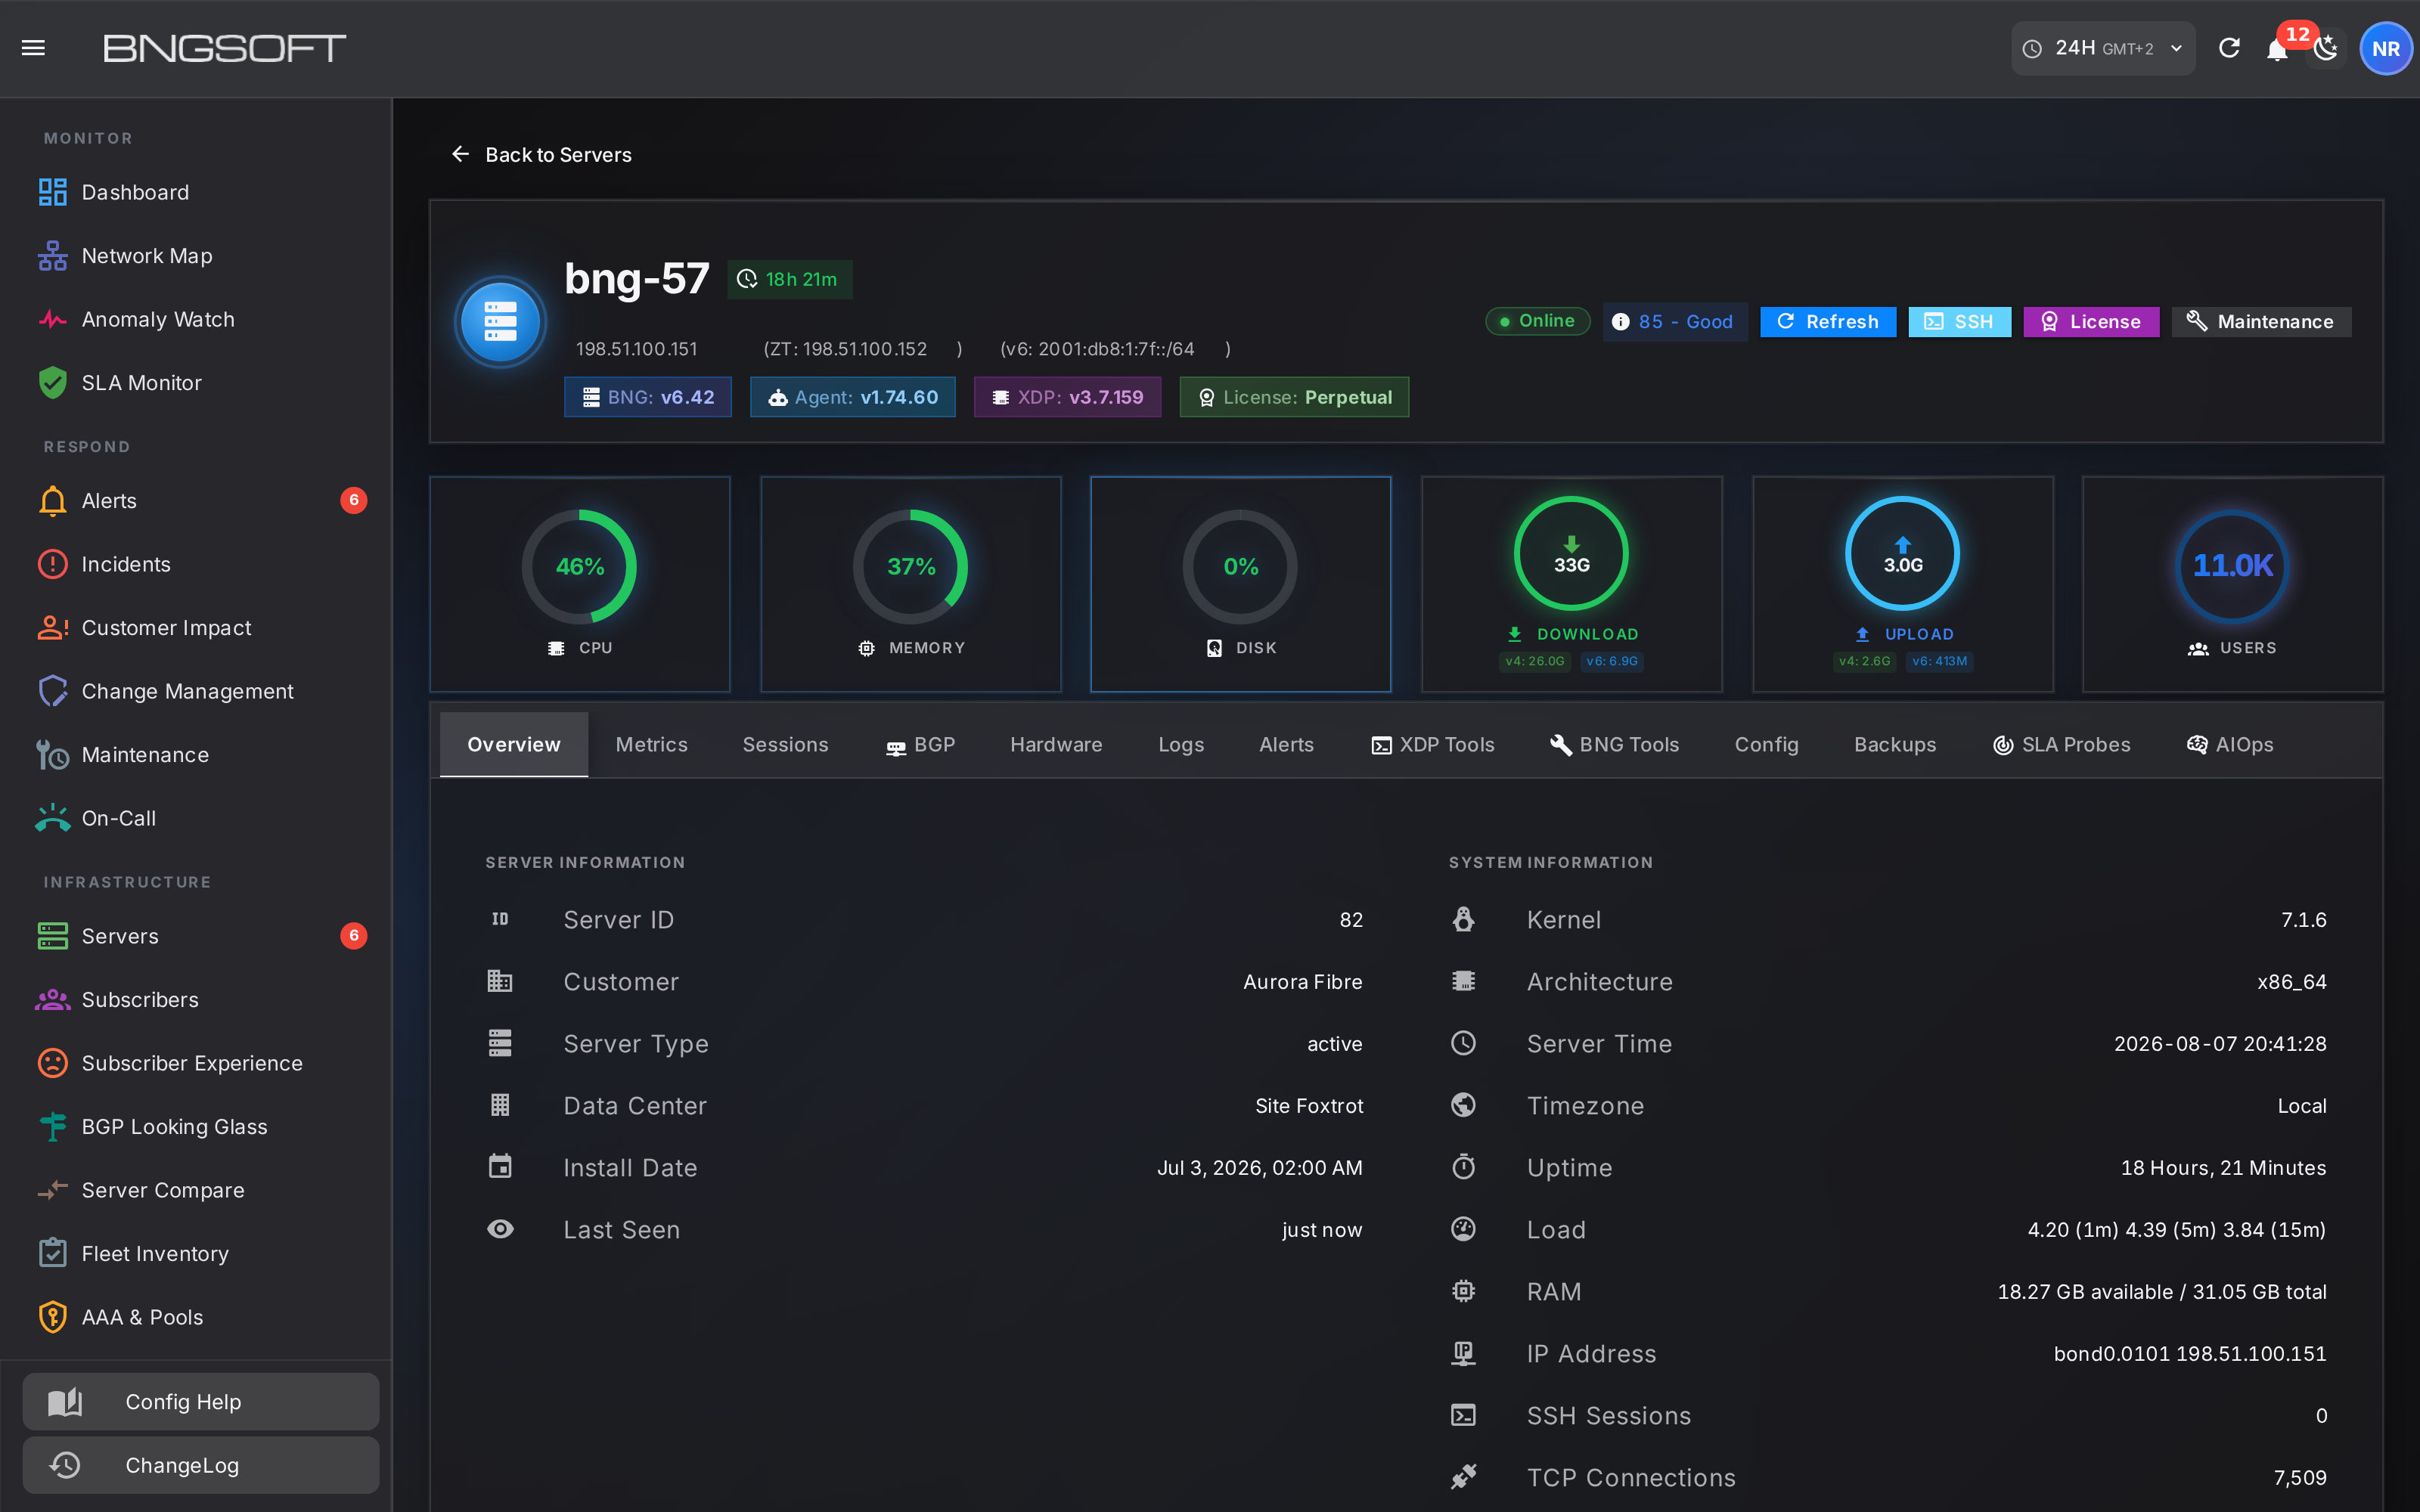
Everything above is the fleet view. Open one gateway and you get thirteen tabs against the same live agent — overview, metrics, sessions, BGP, hardware, logs, alerts, XDP tools, BNG tools, config, backups, SLA probes and AIOps — without opening a terminal.
Overview — the state of one box
Software versions, licence, uptime and live counters sit in a strip that stays visible across every tab, so you never lose the identity of what you are looking at. CPU, memory, disk, download and upload and the current session count are read from the agent, not inferred from a poll of an SNMP counter.
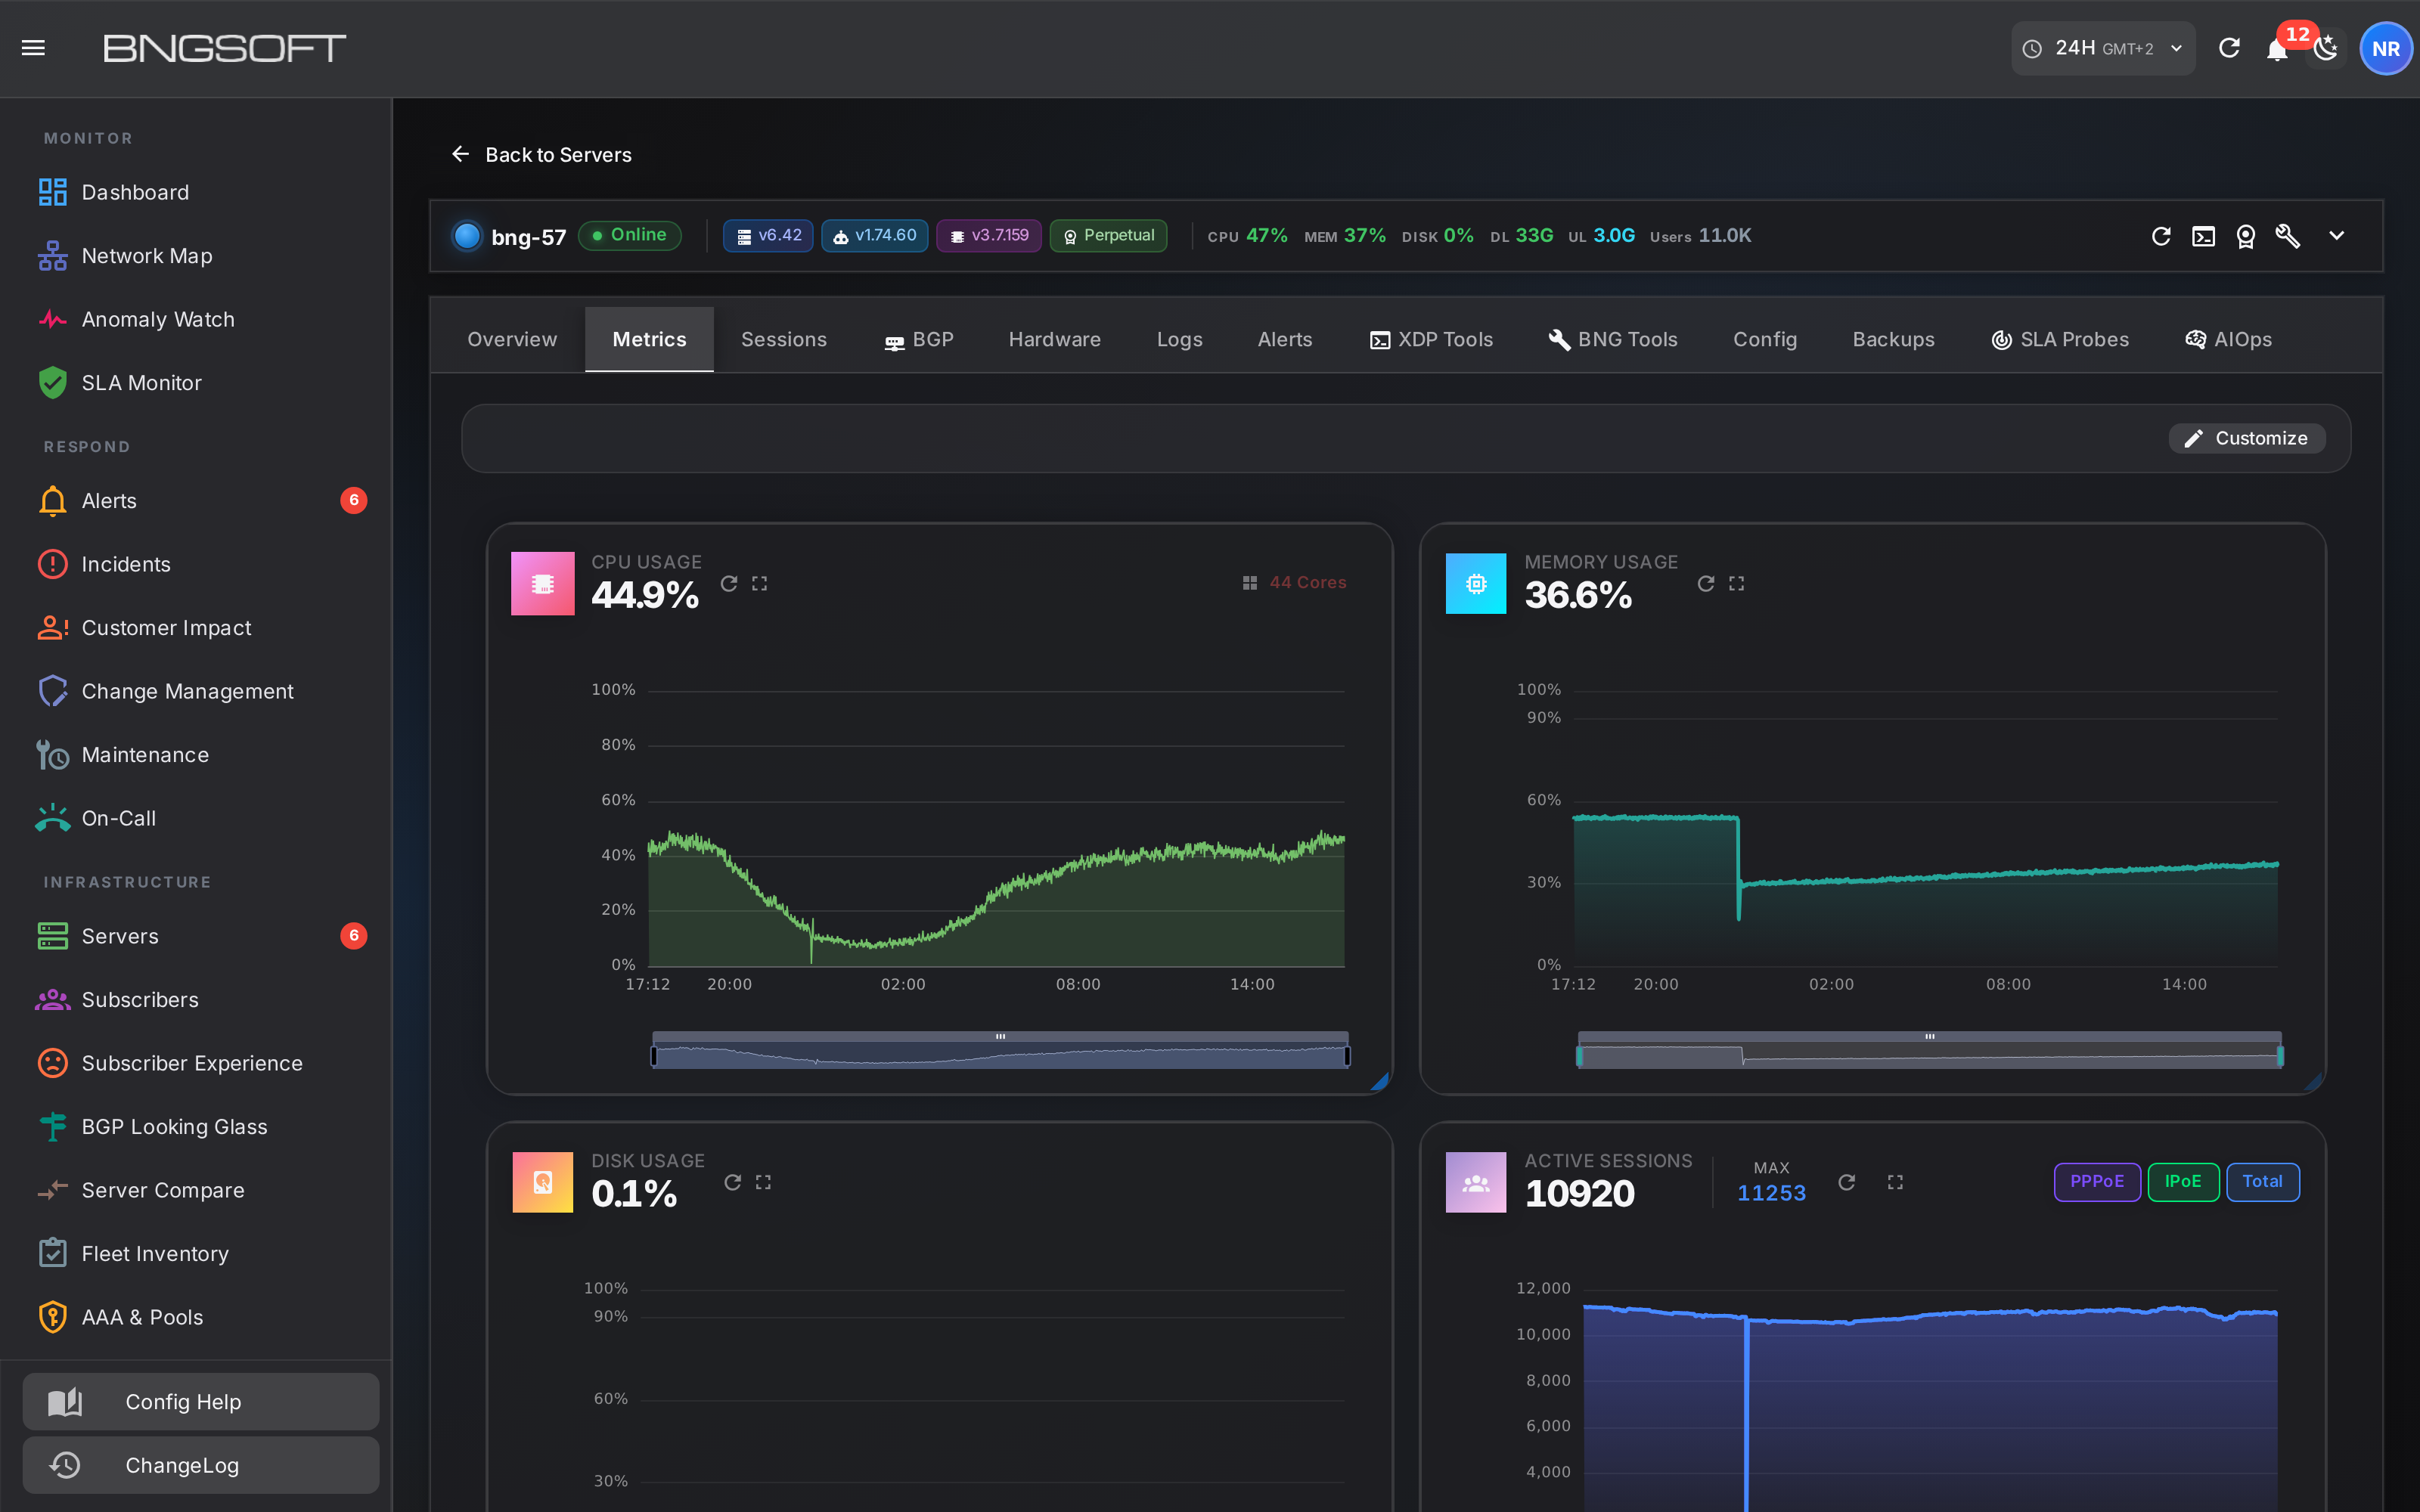
Metrics — what it has been doing
Per-gateway history at 30-second resolution: CPU, memory, throughput split by direction, session counts and interface counters, over any window you choose. Because the agent writes at a fixed cadence, a gap in the chart is a real gap in reporting rather than a rendering artefact — which is exactly what makes the availability figures elsewhere defensible.
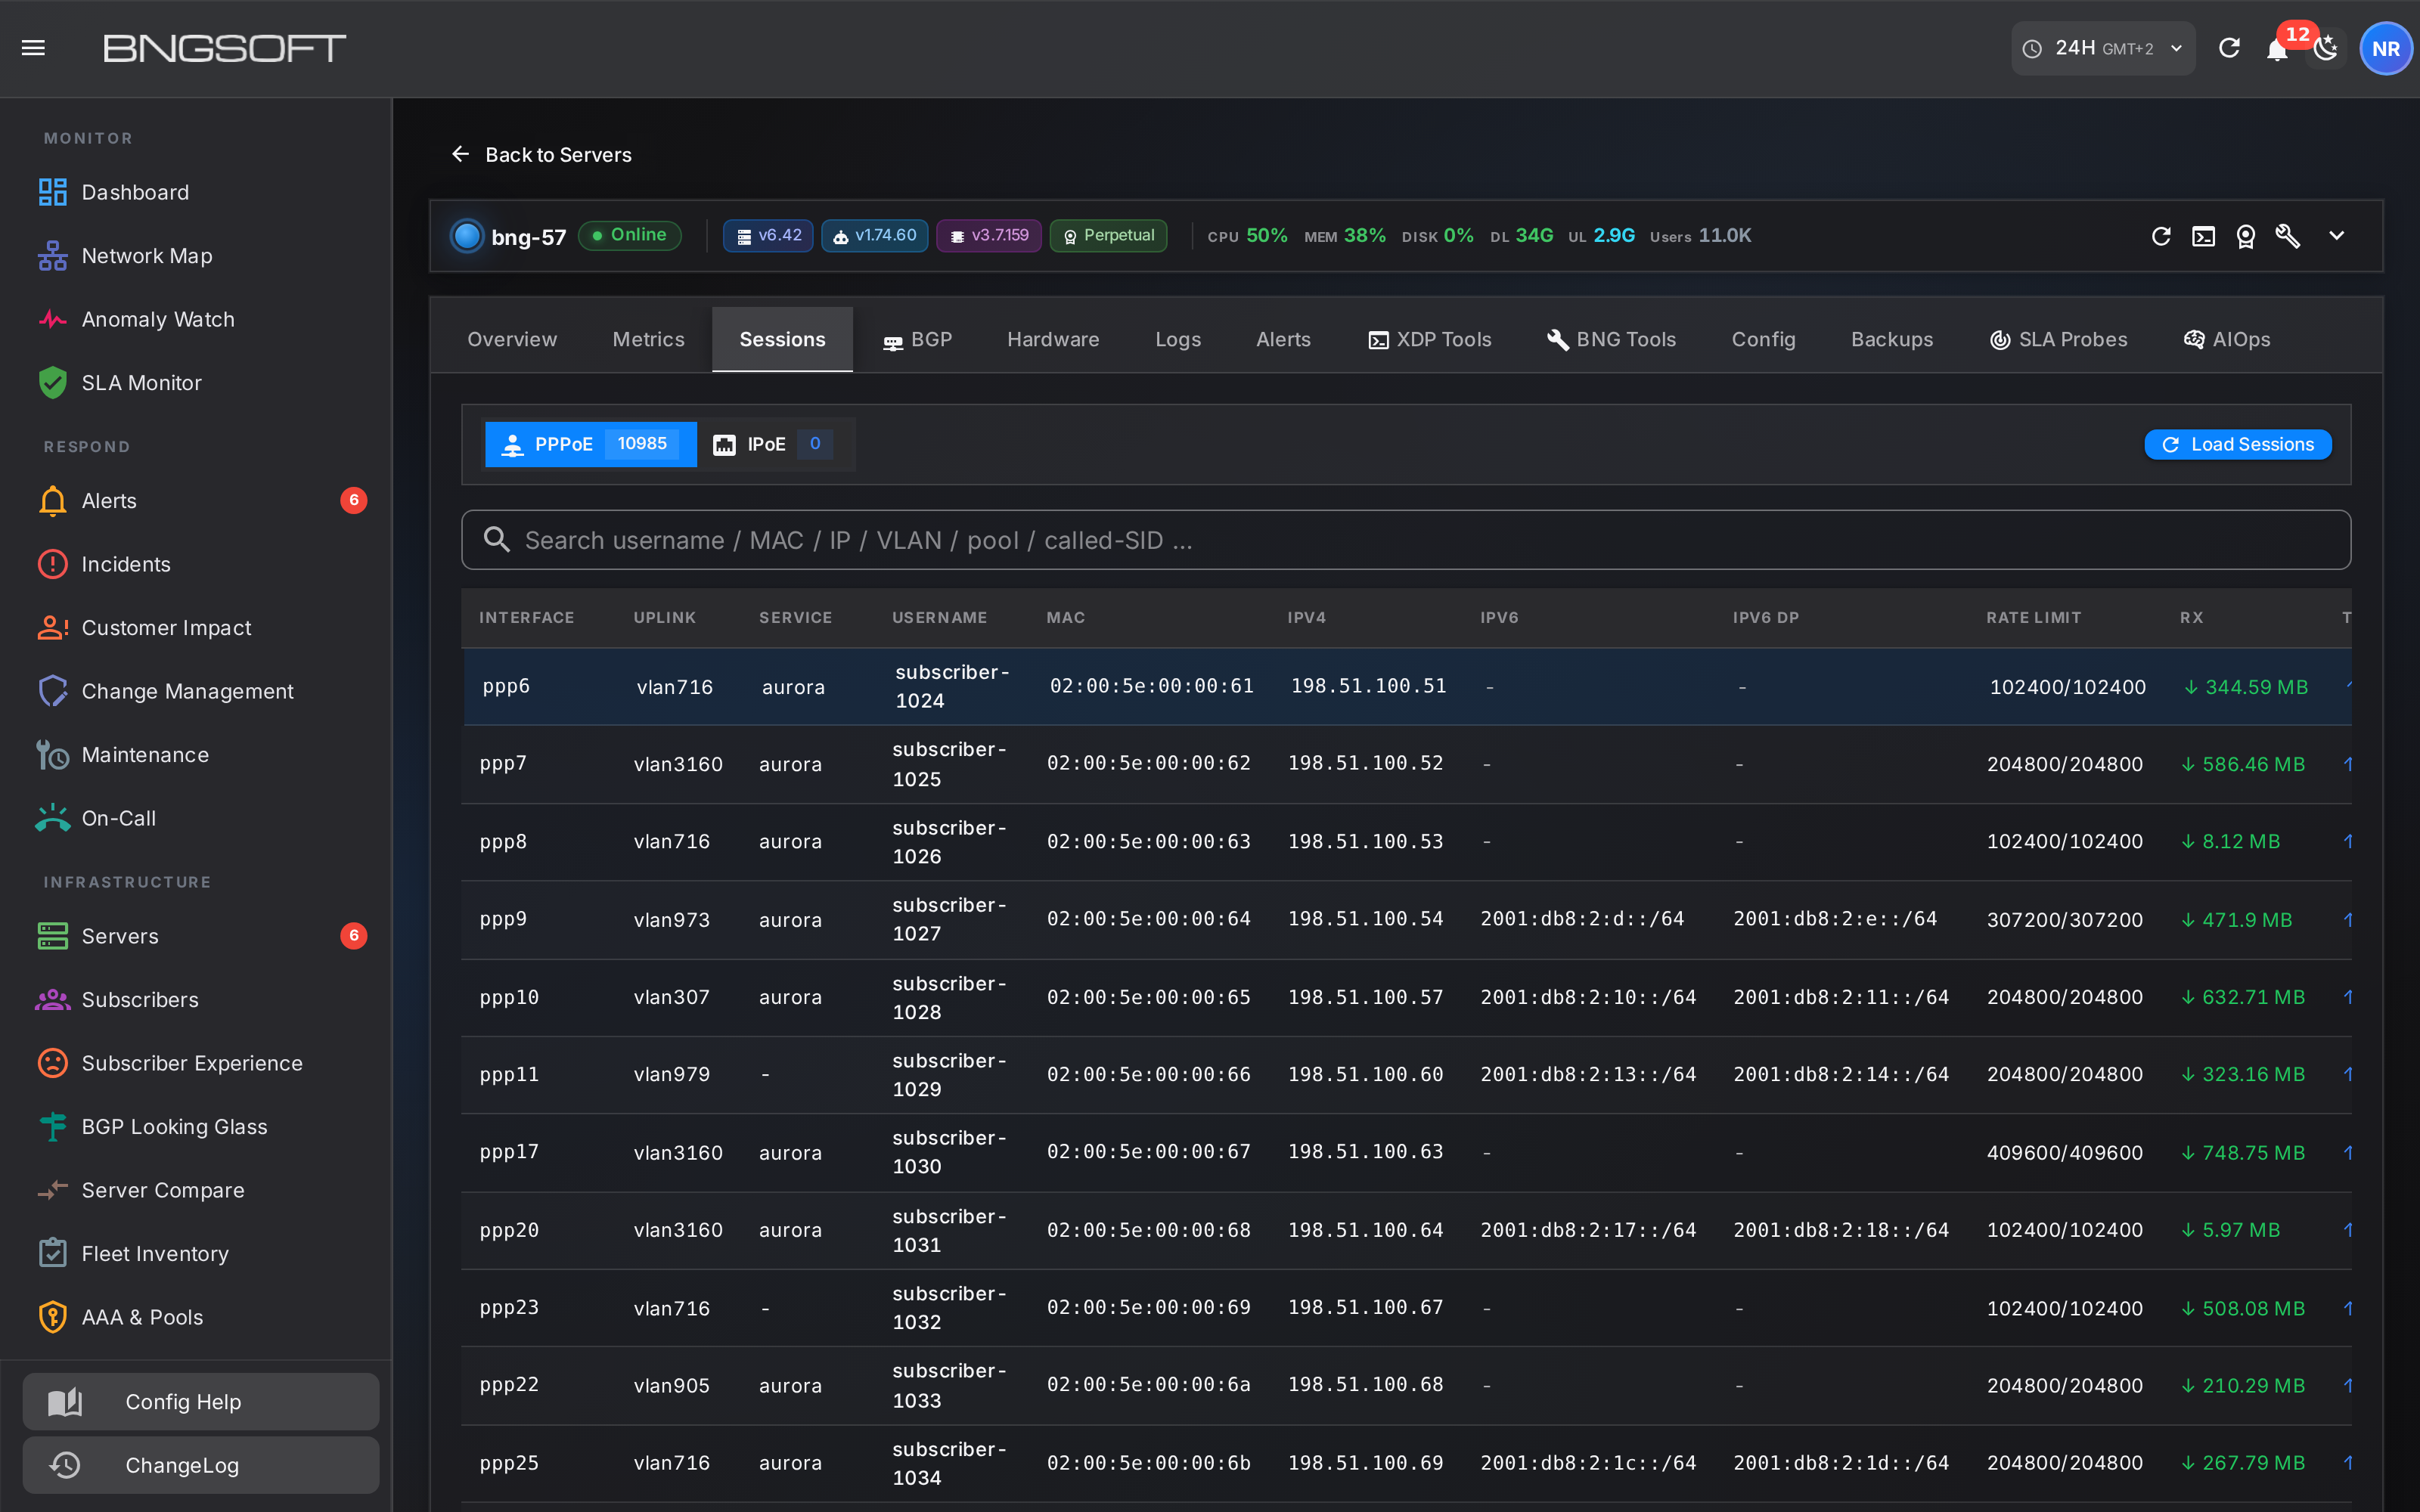
Sessions — every subscriber on the box, right now
The full live session table: interface, uplink VLAN, service, username, MAC, IPv4, IPv6 and delegated prefix, rate limit, and bytes each way. Searchable by any of them — username, MAC, IP, VLAN, pool or called-SID — so a caller who can only give you their MAC is still a one-field lookup. PPPoE and IPoE are counted separately, because a gateway serving both should never make you guess which one broke.
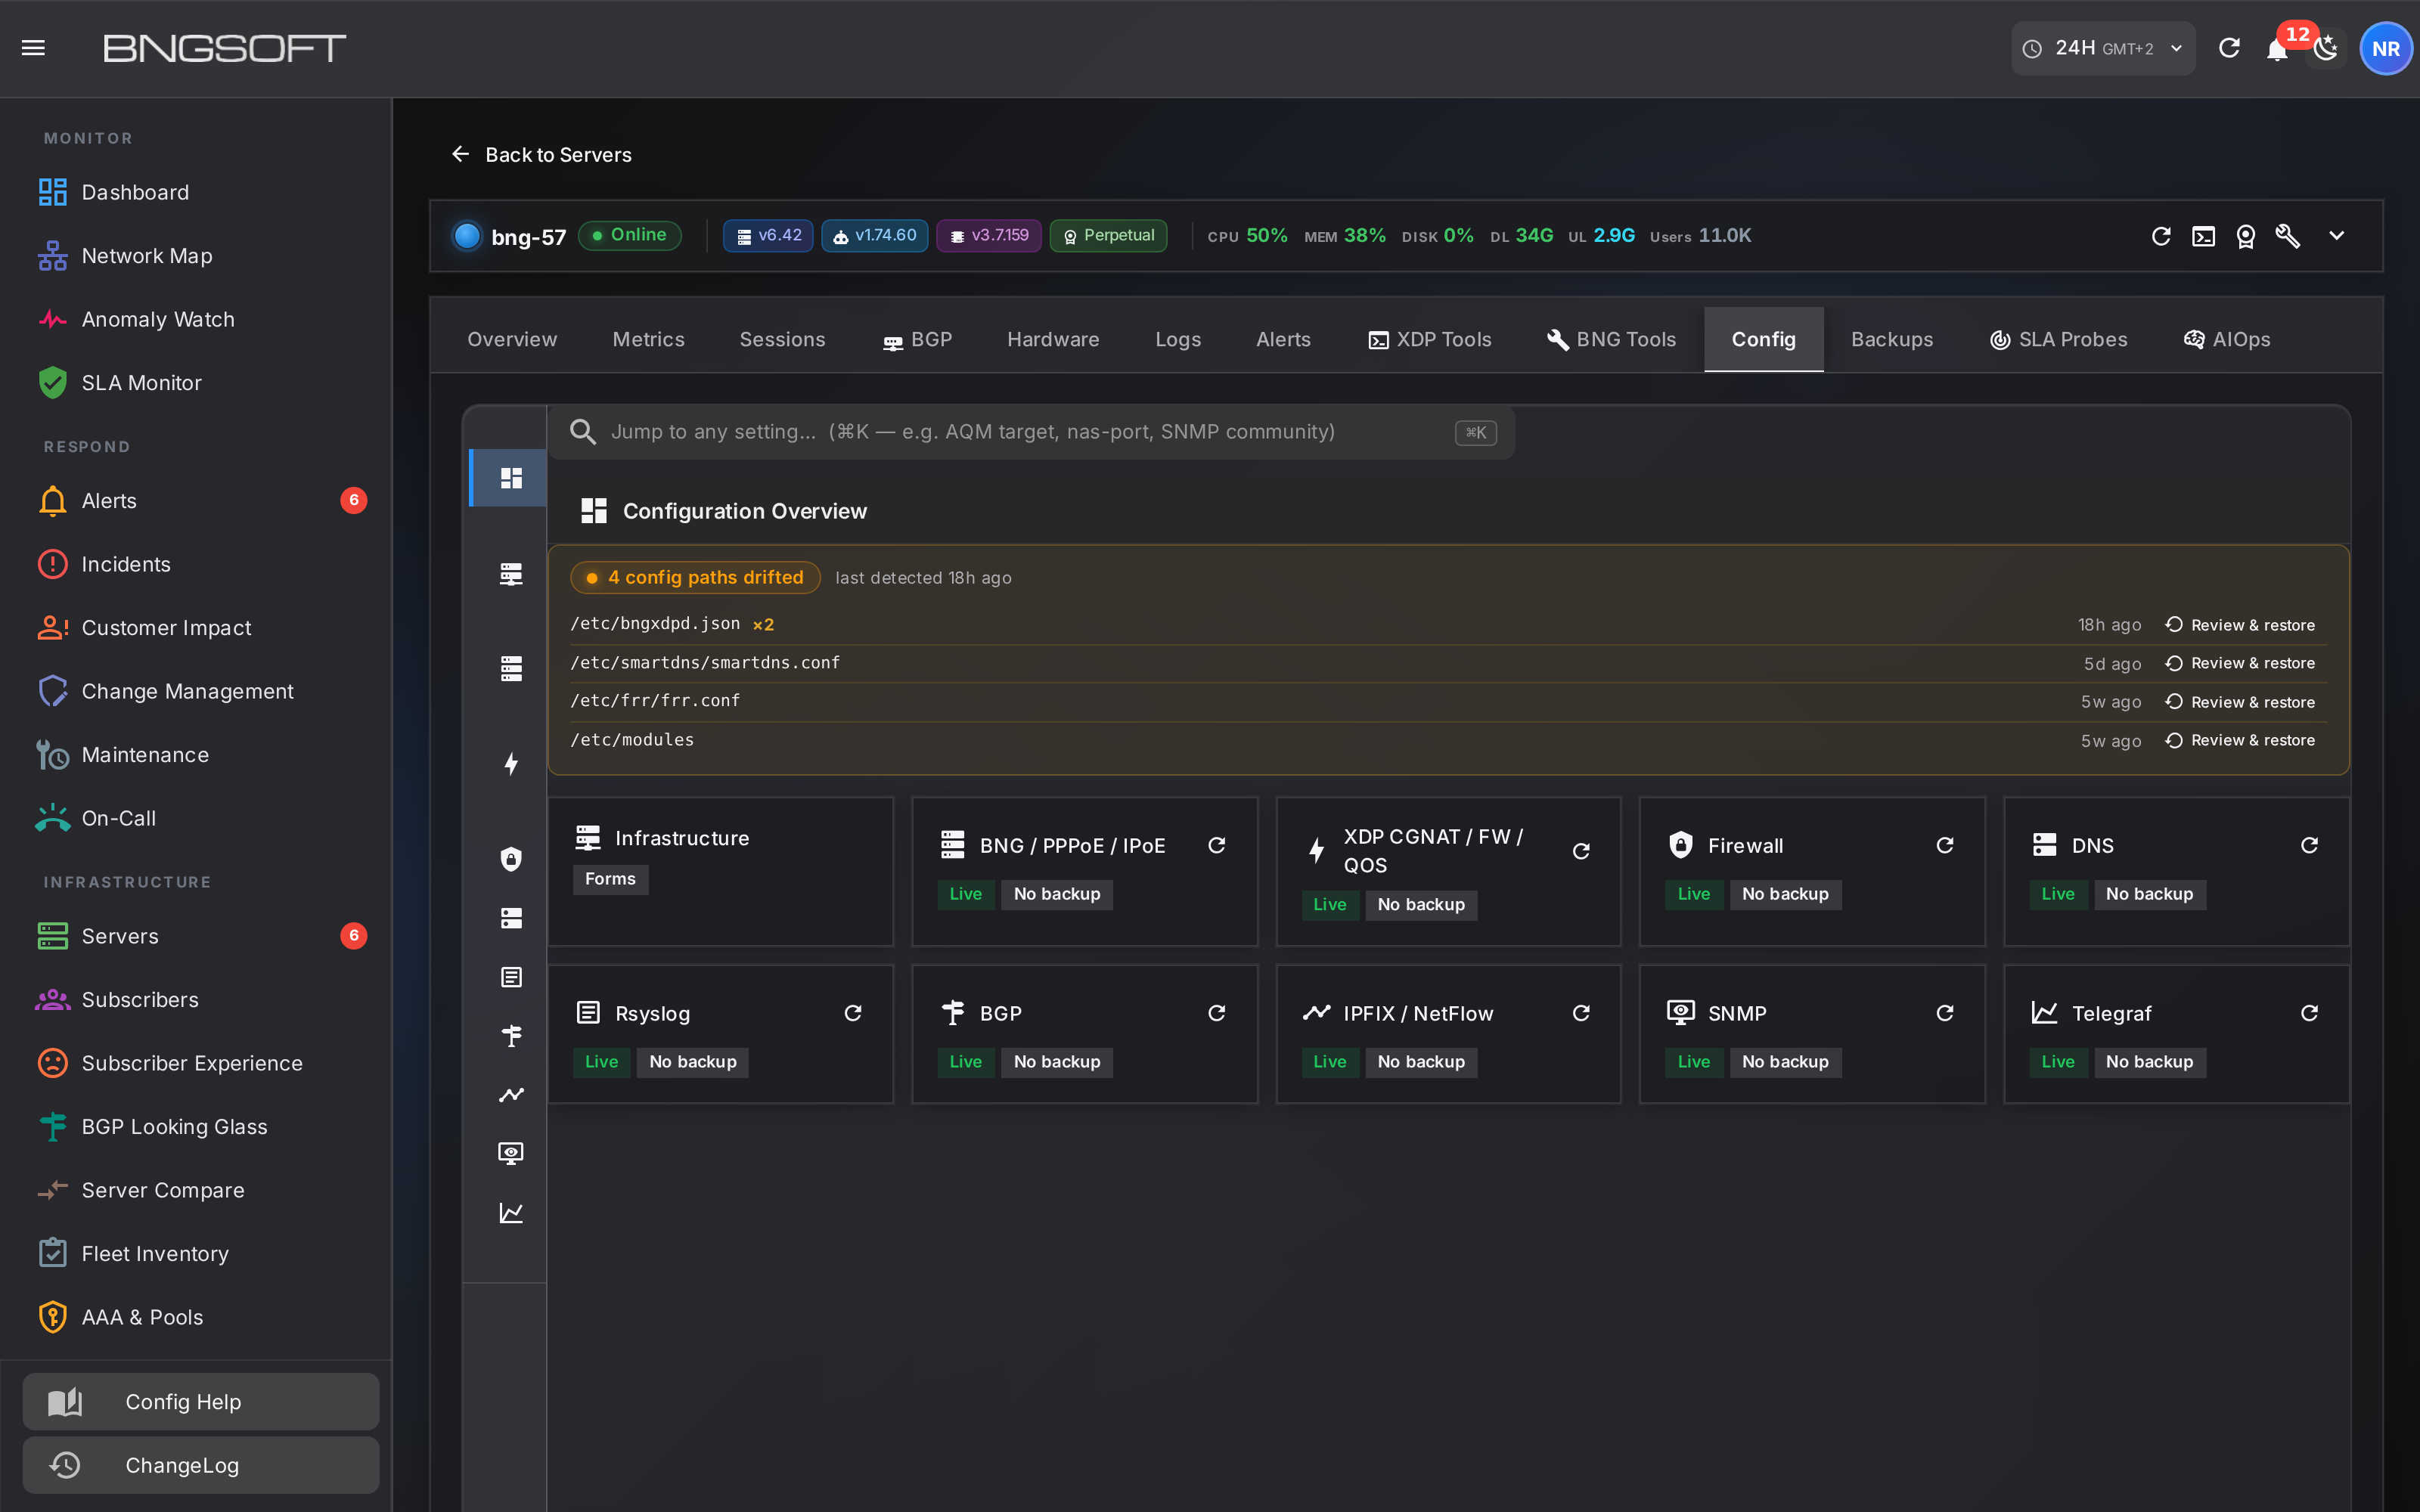
Config — versioned, compared, restorable
The running configuration is read back from the gateway, stored with history, and compared against the last known-good version. Drift is shown as a difference rather than a warning light, and a previous version can be restored after a preview of exactly what would change.
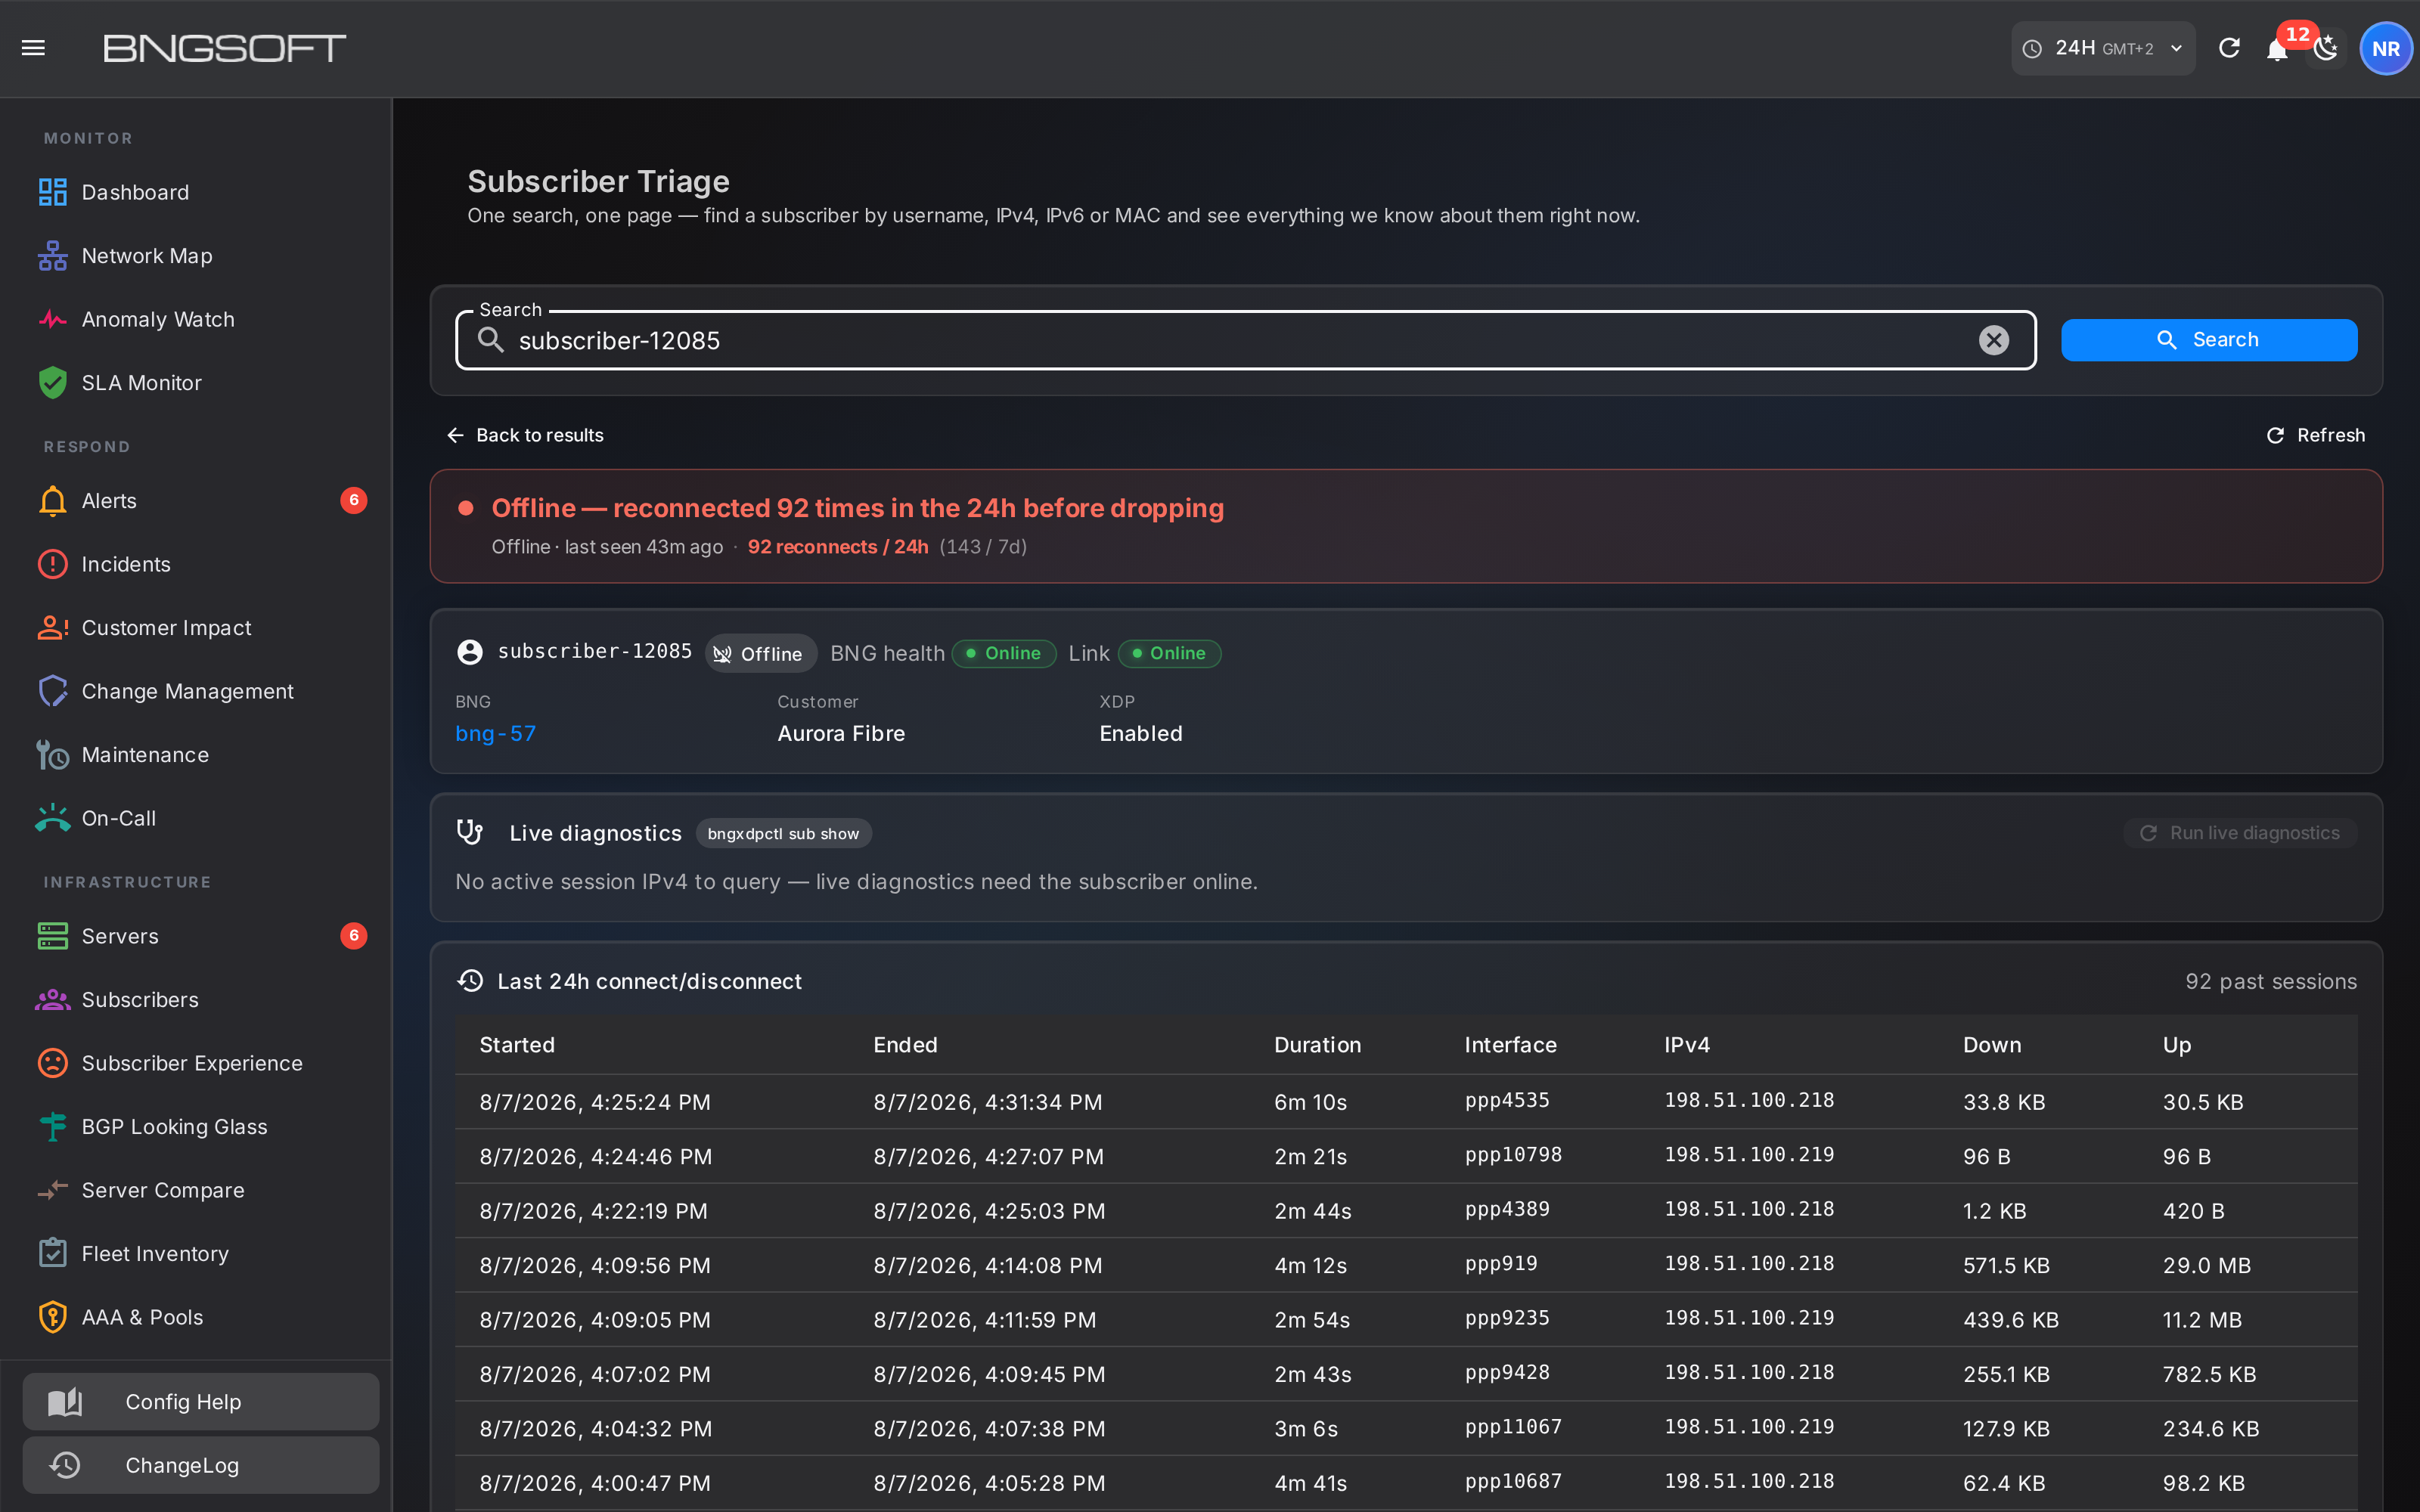
Answering the phone: Subscriber Triage
Tools → Subscriber Triage takes whatever the caller can give you — username, IPv4, IPv6 or MAC — and returns one page about that person.
A plain-language verdict at the top, the current session beneath it, reconnect counts over 24 hours and 7 days, the health of the gateway they are on, and a full connect/disconnect history so a claim of "it keeps dropping" is either confirmed or disproved in seconds. Where the subscriber is online, the forwarding plane can be queried directly for a live read.
Any identifier
Username, IPv4, IPv6 or MAC in any common format. The desk does not need to know which one it has been given.
Their line or your network
The gateway's own health is shown beside the subscriber's, so "everyone on that box is fine" is a visible answer rather than an assumption.
Live when it matters
For an online subscriber the forwarding plane can be asked directly, on demand — never polled in the background for a quarter of a million people.
The rest of the toolbox
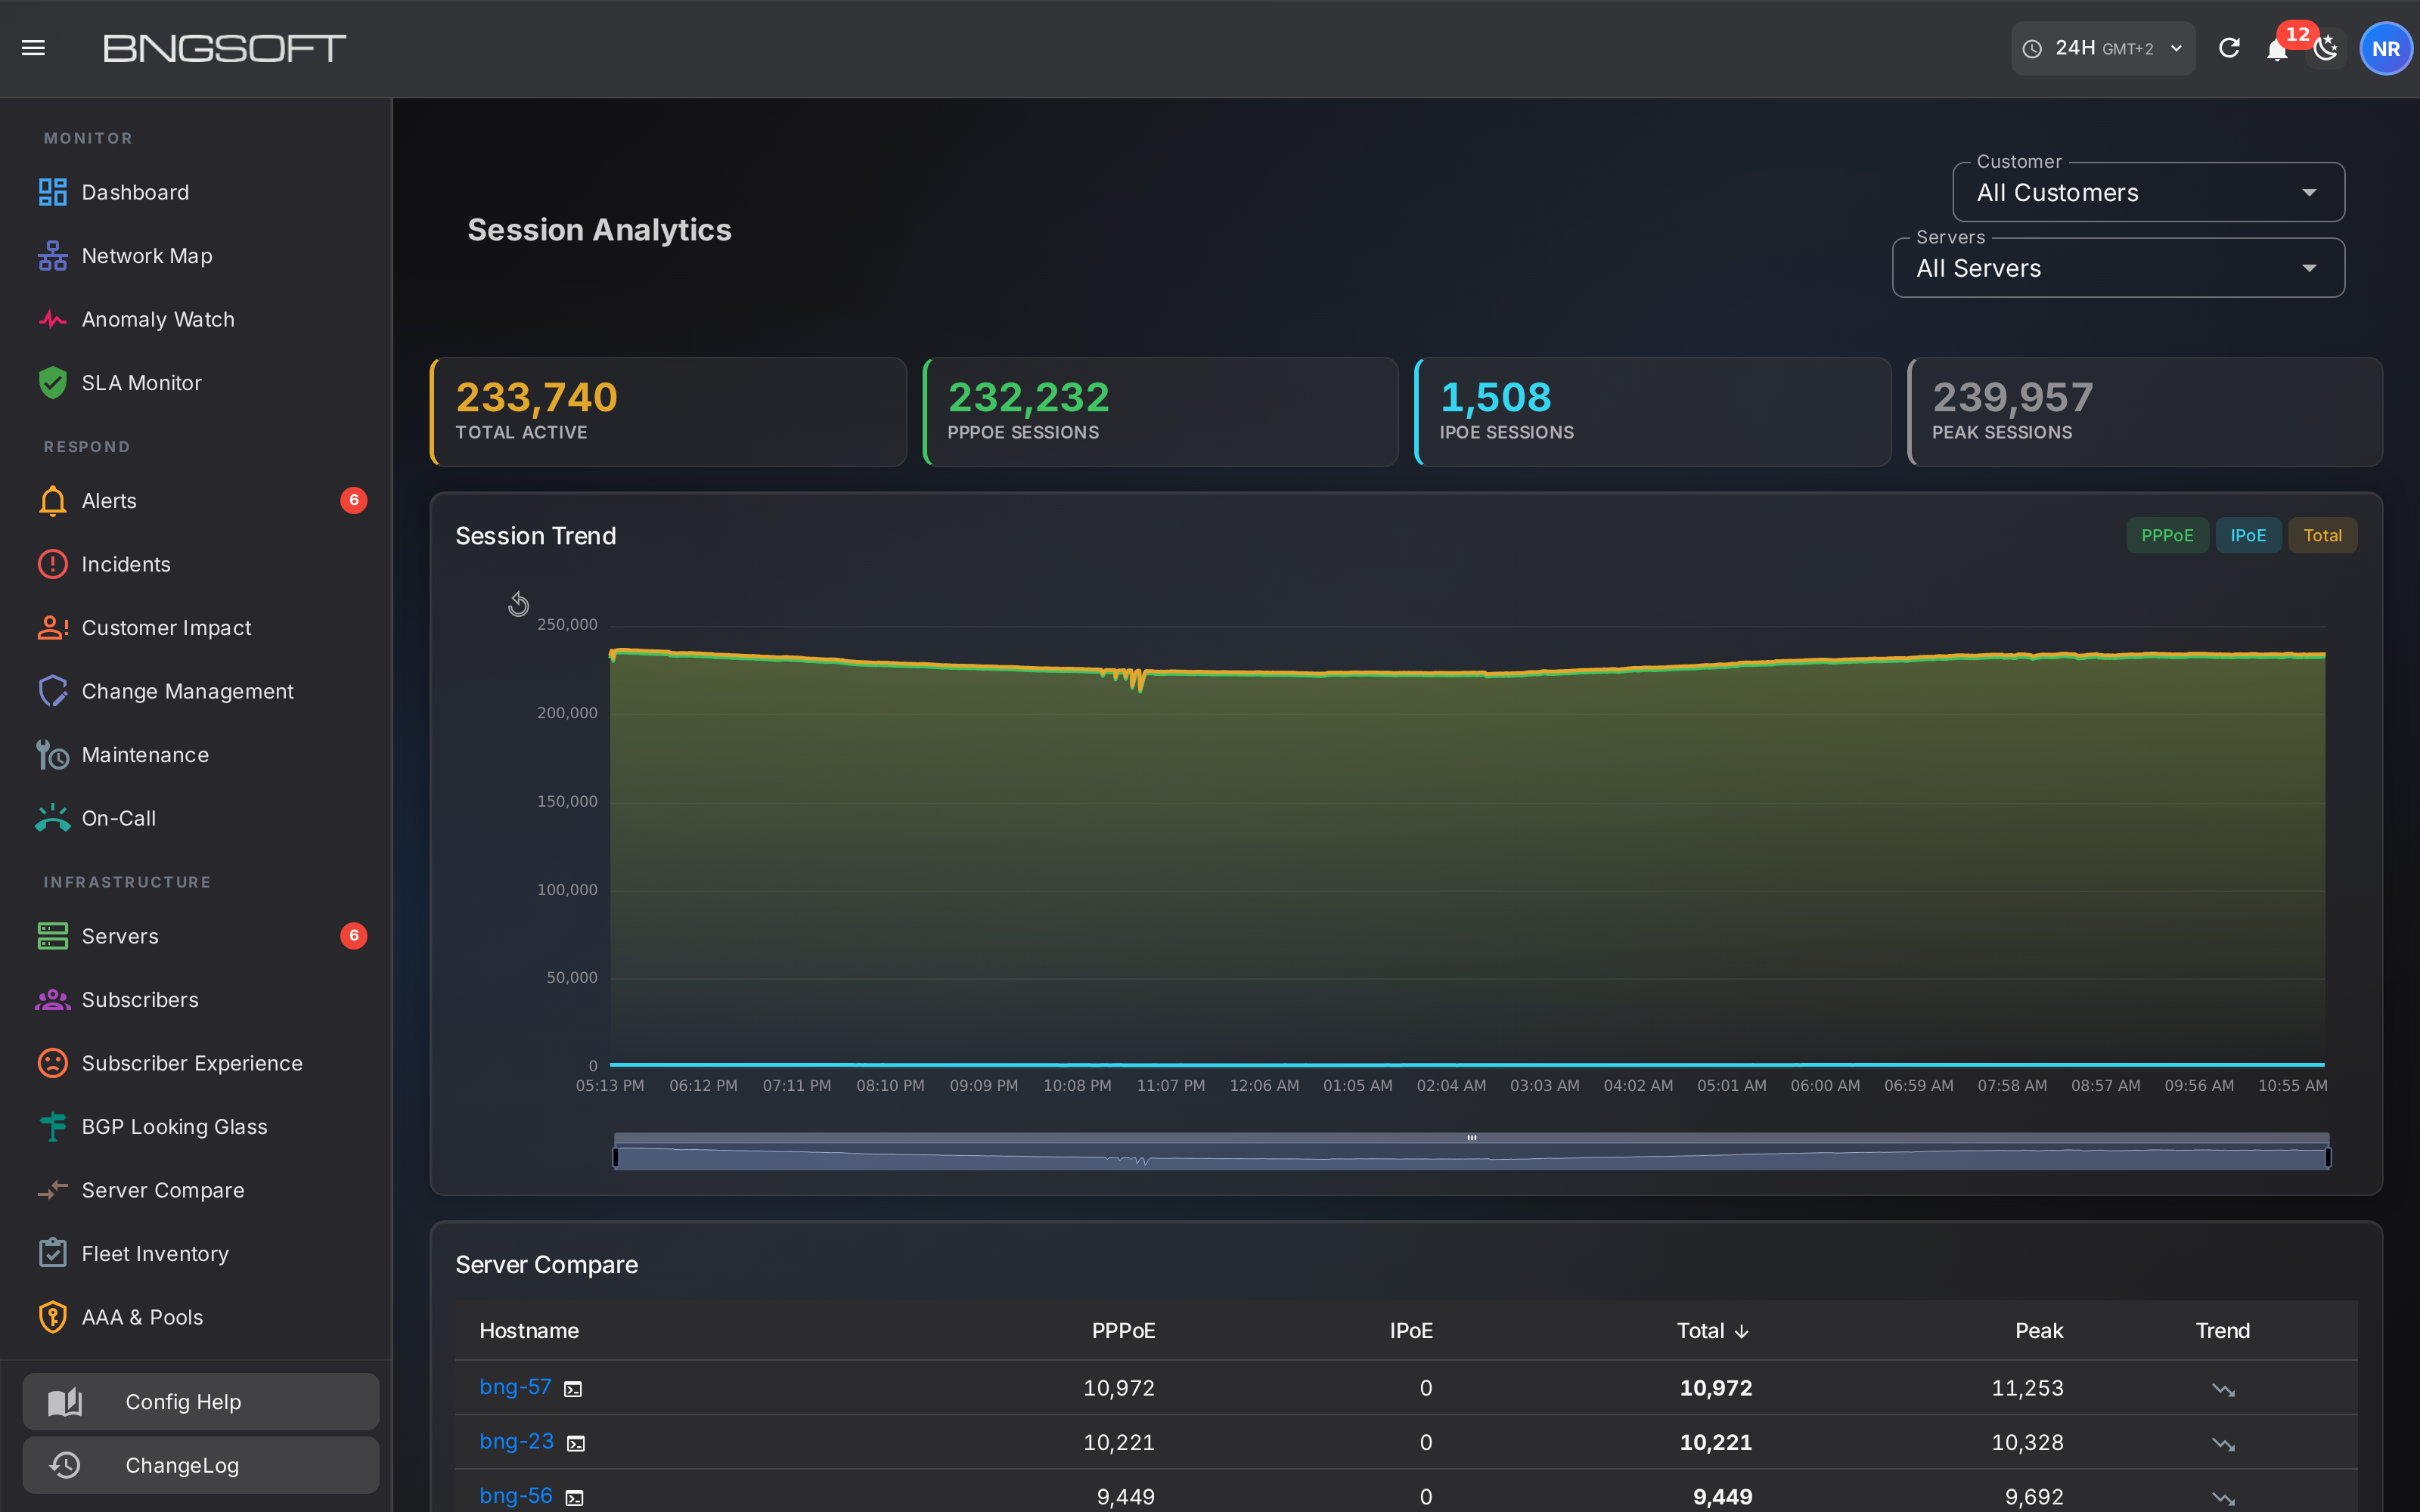
Session analytics
Session behaviour across the estate rather than one subscriber at a time: connection volumes, durations and churn over time, by gateway and by operator. This is where a pattern that affects a whole site — rather than one unlucky customer — becomes obvious.
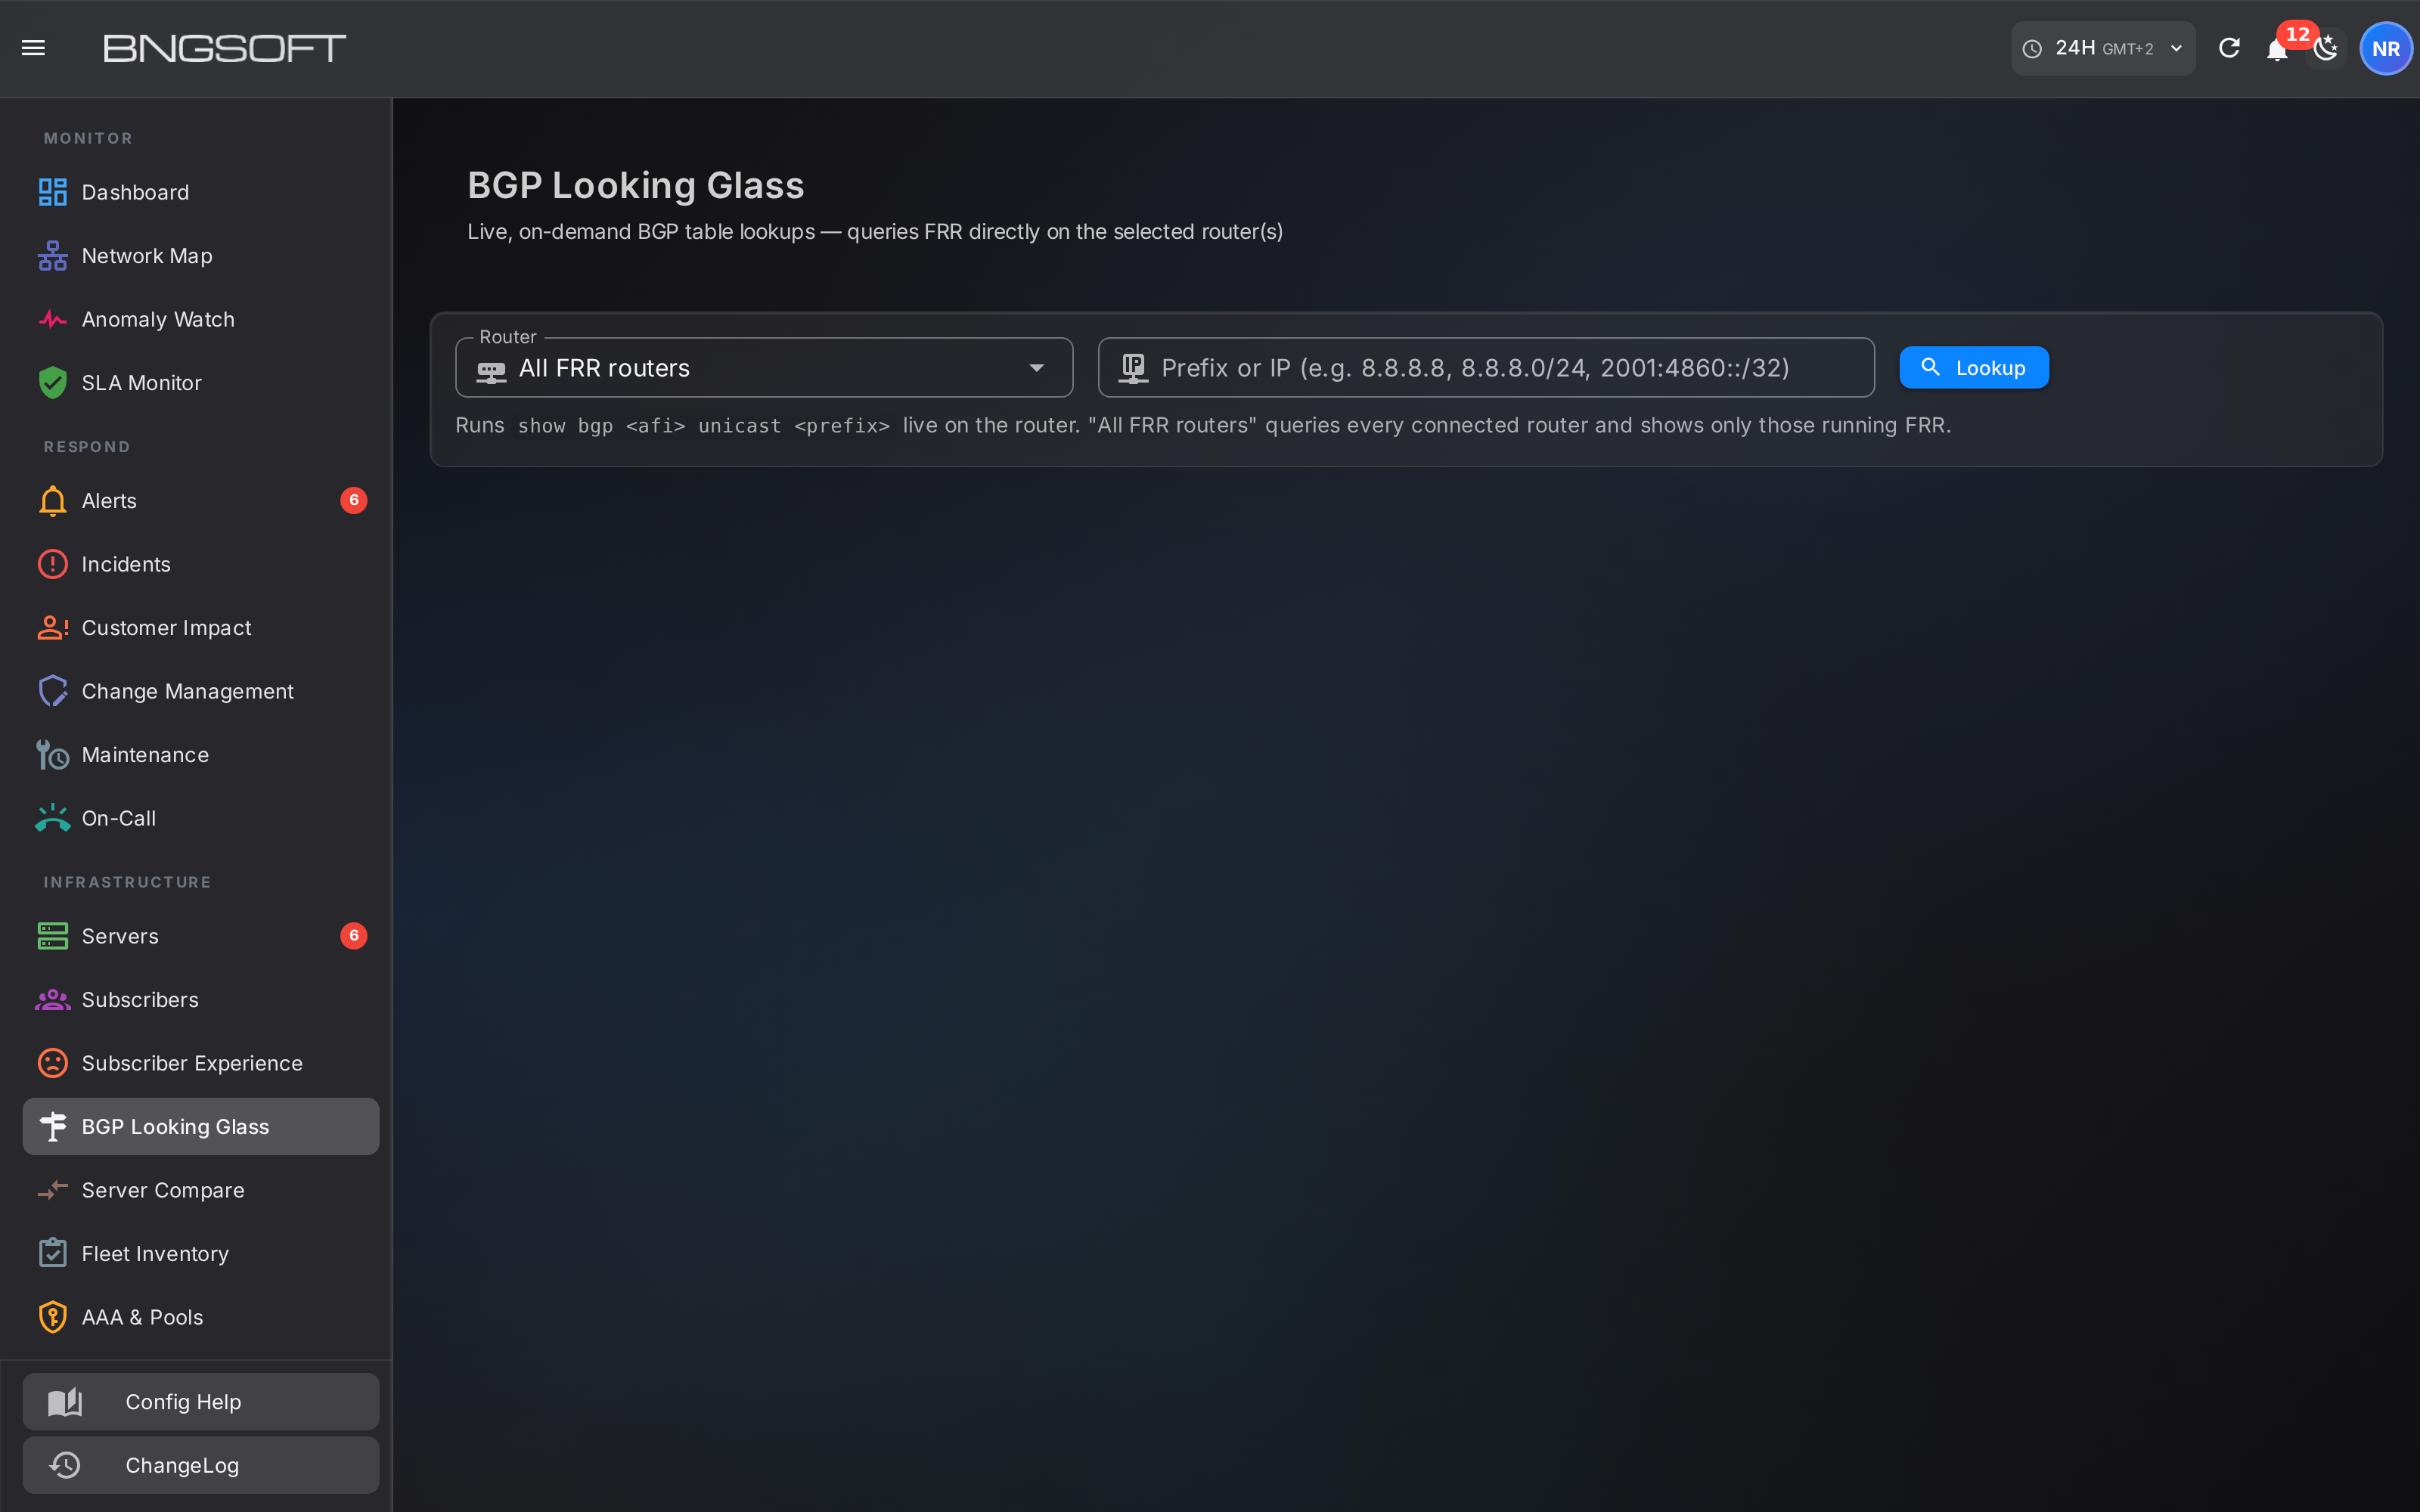
BGP looking glass
Peer state and received routes per gateway, from the platform rather than an SSH session. Sessions that flap or drop are visible next to the subscriber impact they cause, which is the pairing that usually goes missing when routing and subscriber management are separate tools.
Network map
The estate drawn by site and role, with live state on each node.
Server compare
Two gateways side by side — configuration, versions and behaviour — for when one of a matched pair misbehaves.
Config backups
Point-in-time copies kept per gateway, with restore preview. No sidecar files left on the box.
XDP and BNG tools
Forwarding-plane commands from the console, with their output captured against the gateway and the operator who ran them.
SLA probes
Synthetic reachability tests from the gateway outward, so a path problem is separated from a platform problem.
Lawful intercept
Warrant lifecycle with signed export bundles, subject-access handling and a legal hold that survives retention pruning.
One score, for the person who owns the network
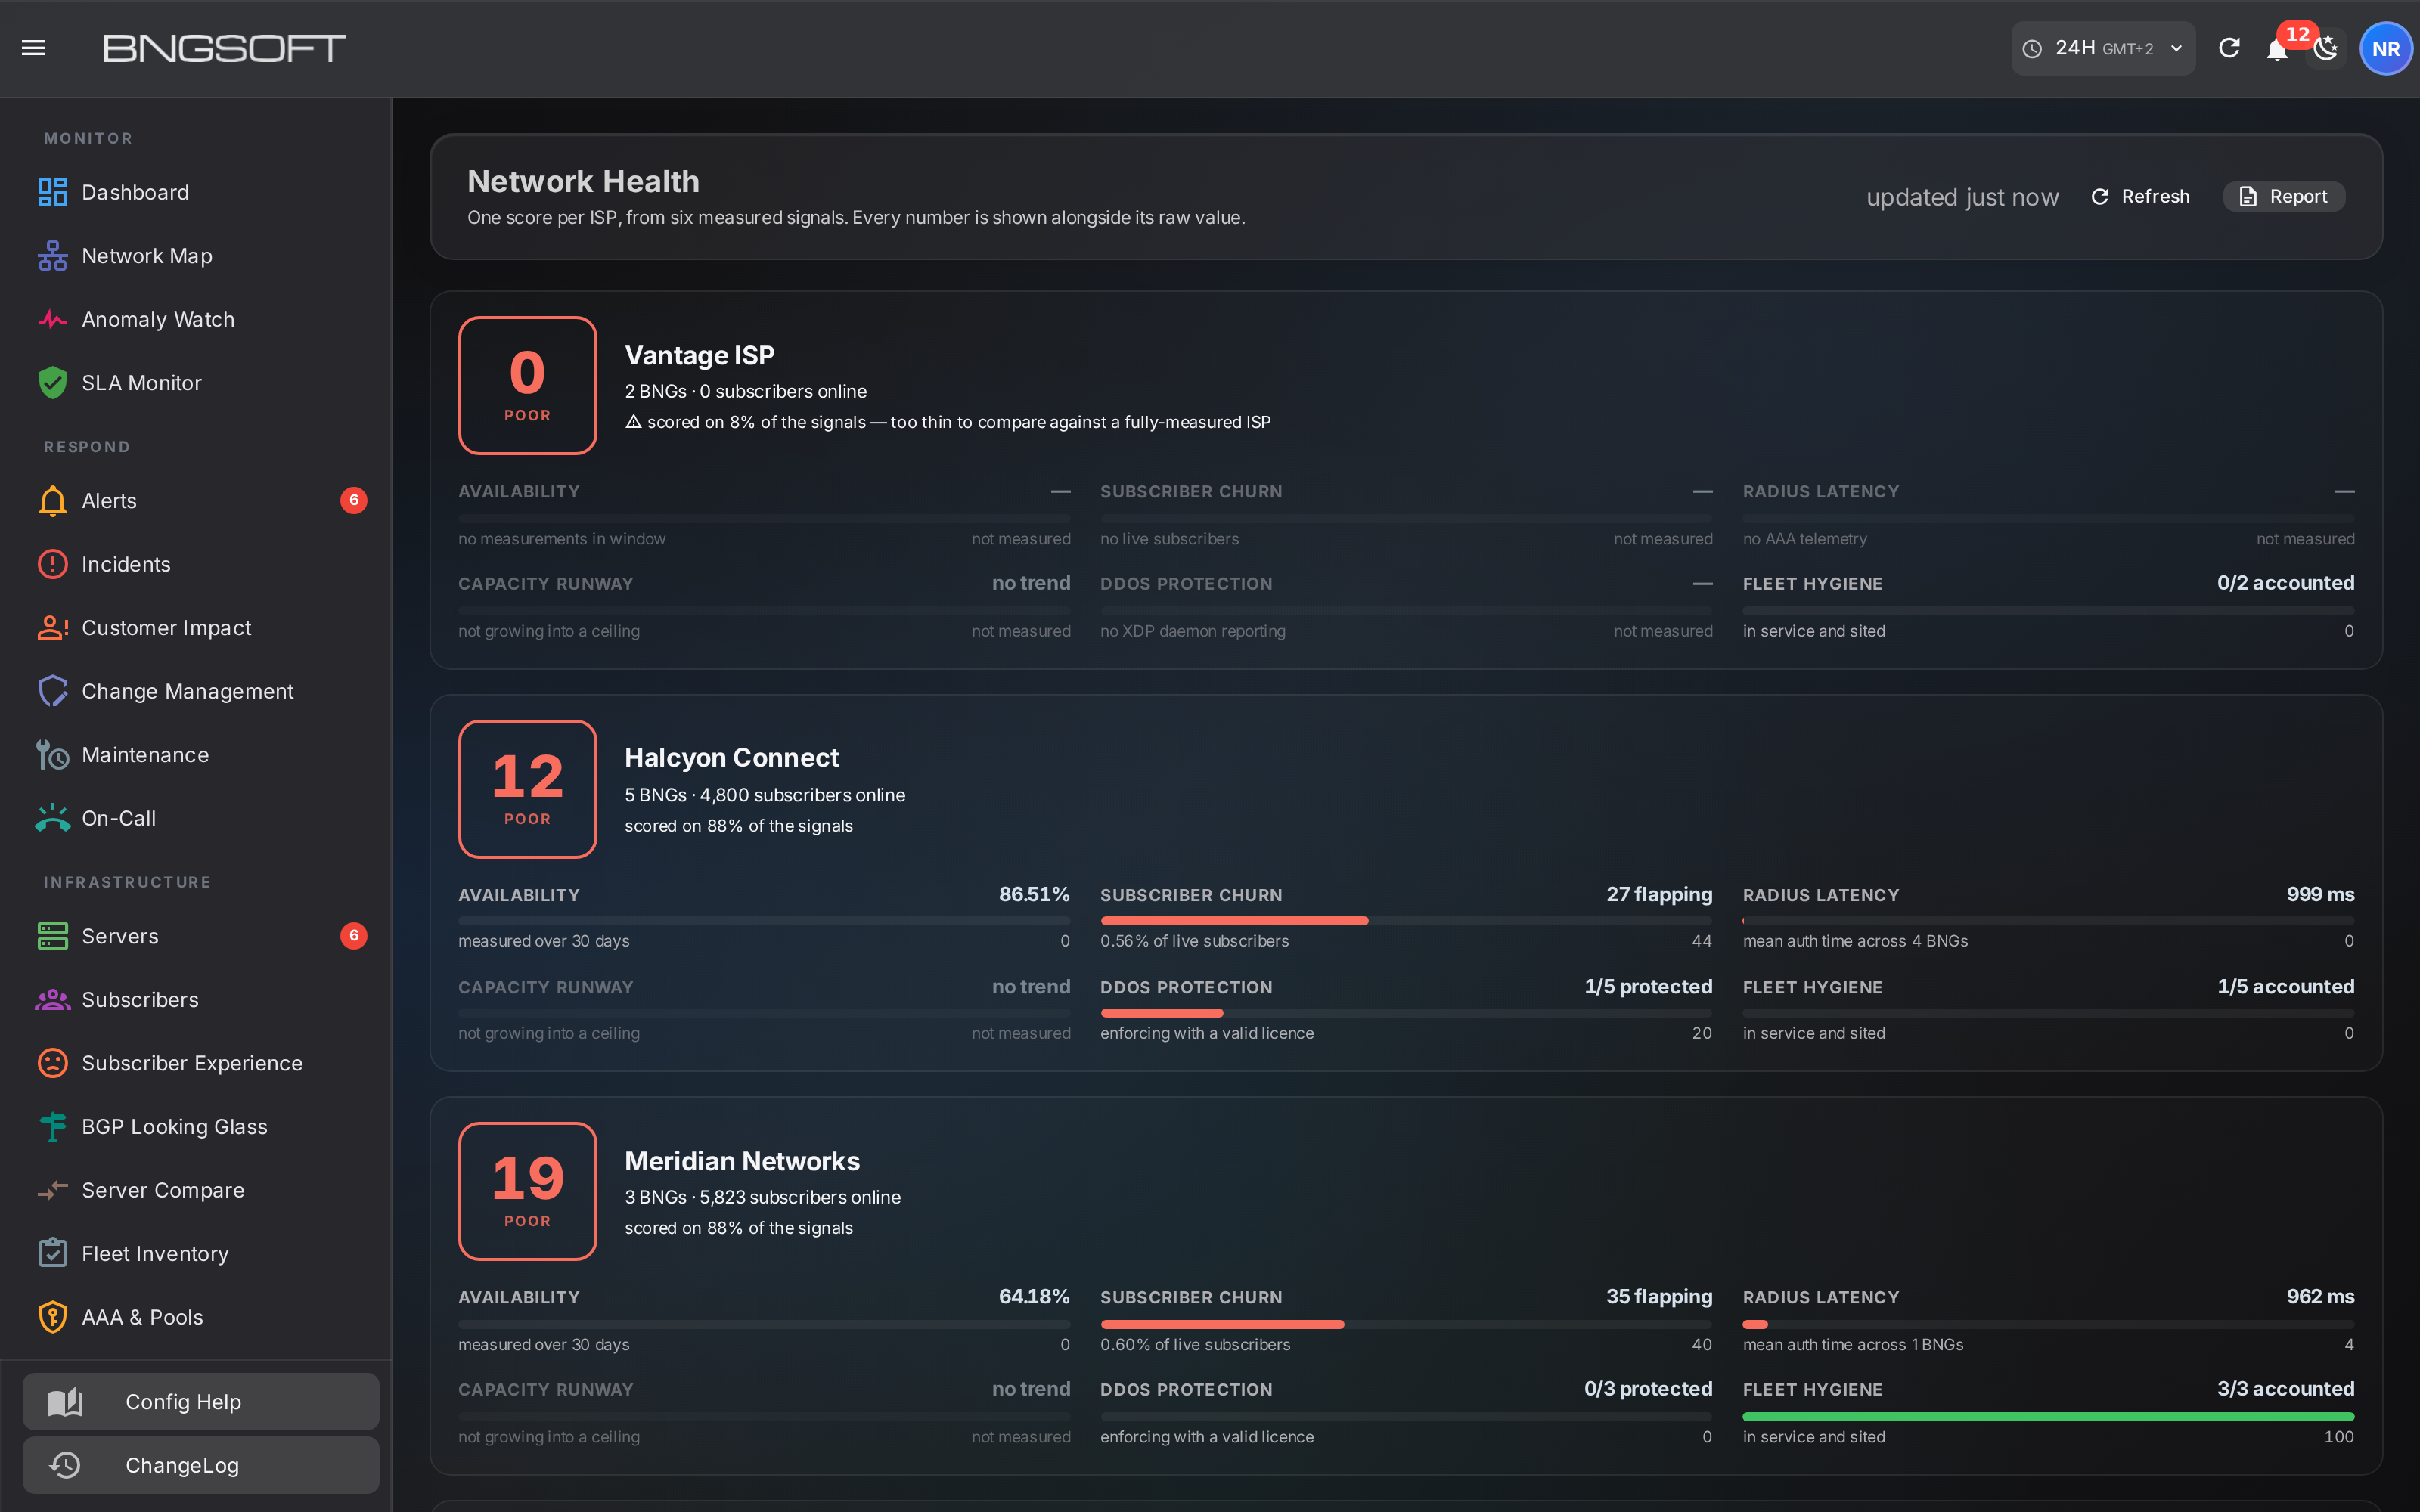
Availability, subscriber churn, authentication latency, capacity runway, protection posture and inventory hygiene are each measured somewhere in the platform. Network Health rolls them into a single score per operator — with the raw measurement printed next to every component, the weights published, and the proportion of signals actually available stated on the card.
And a screen for the room
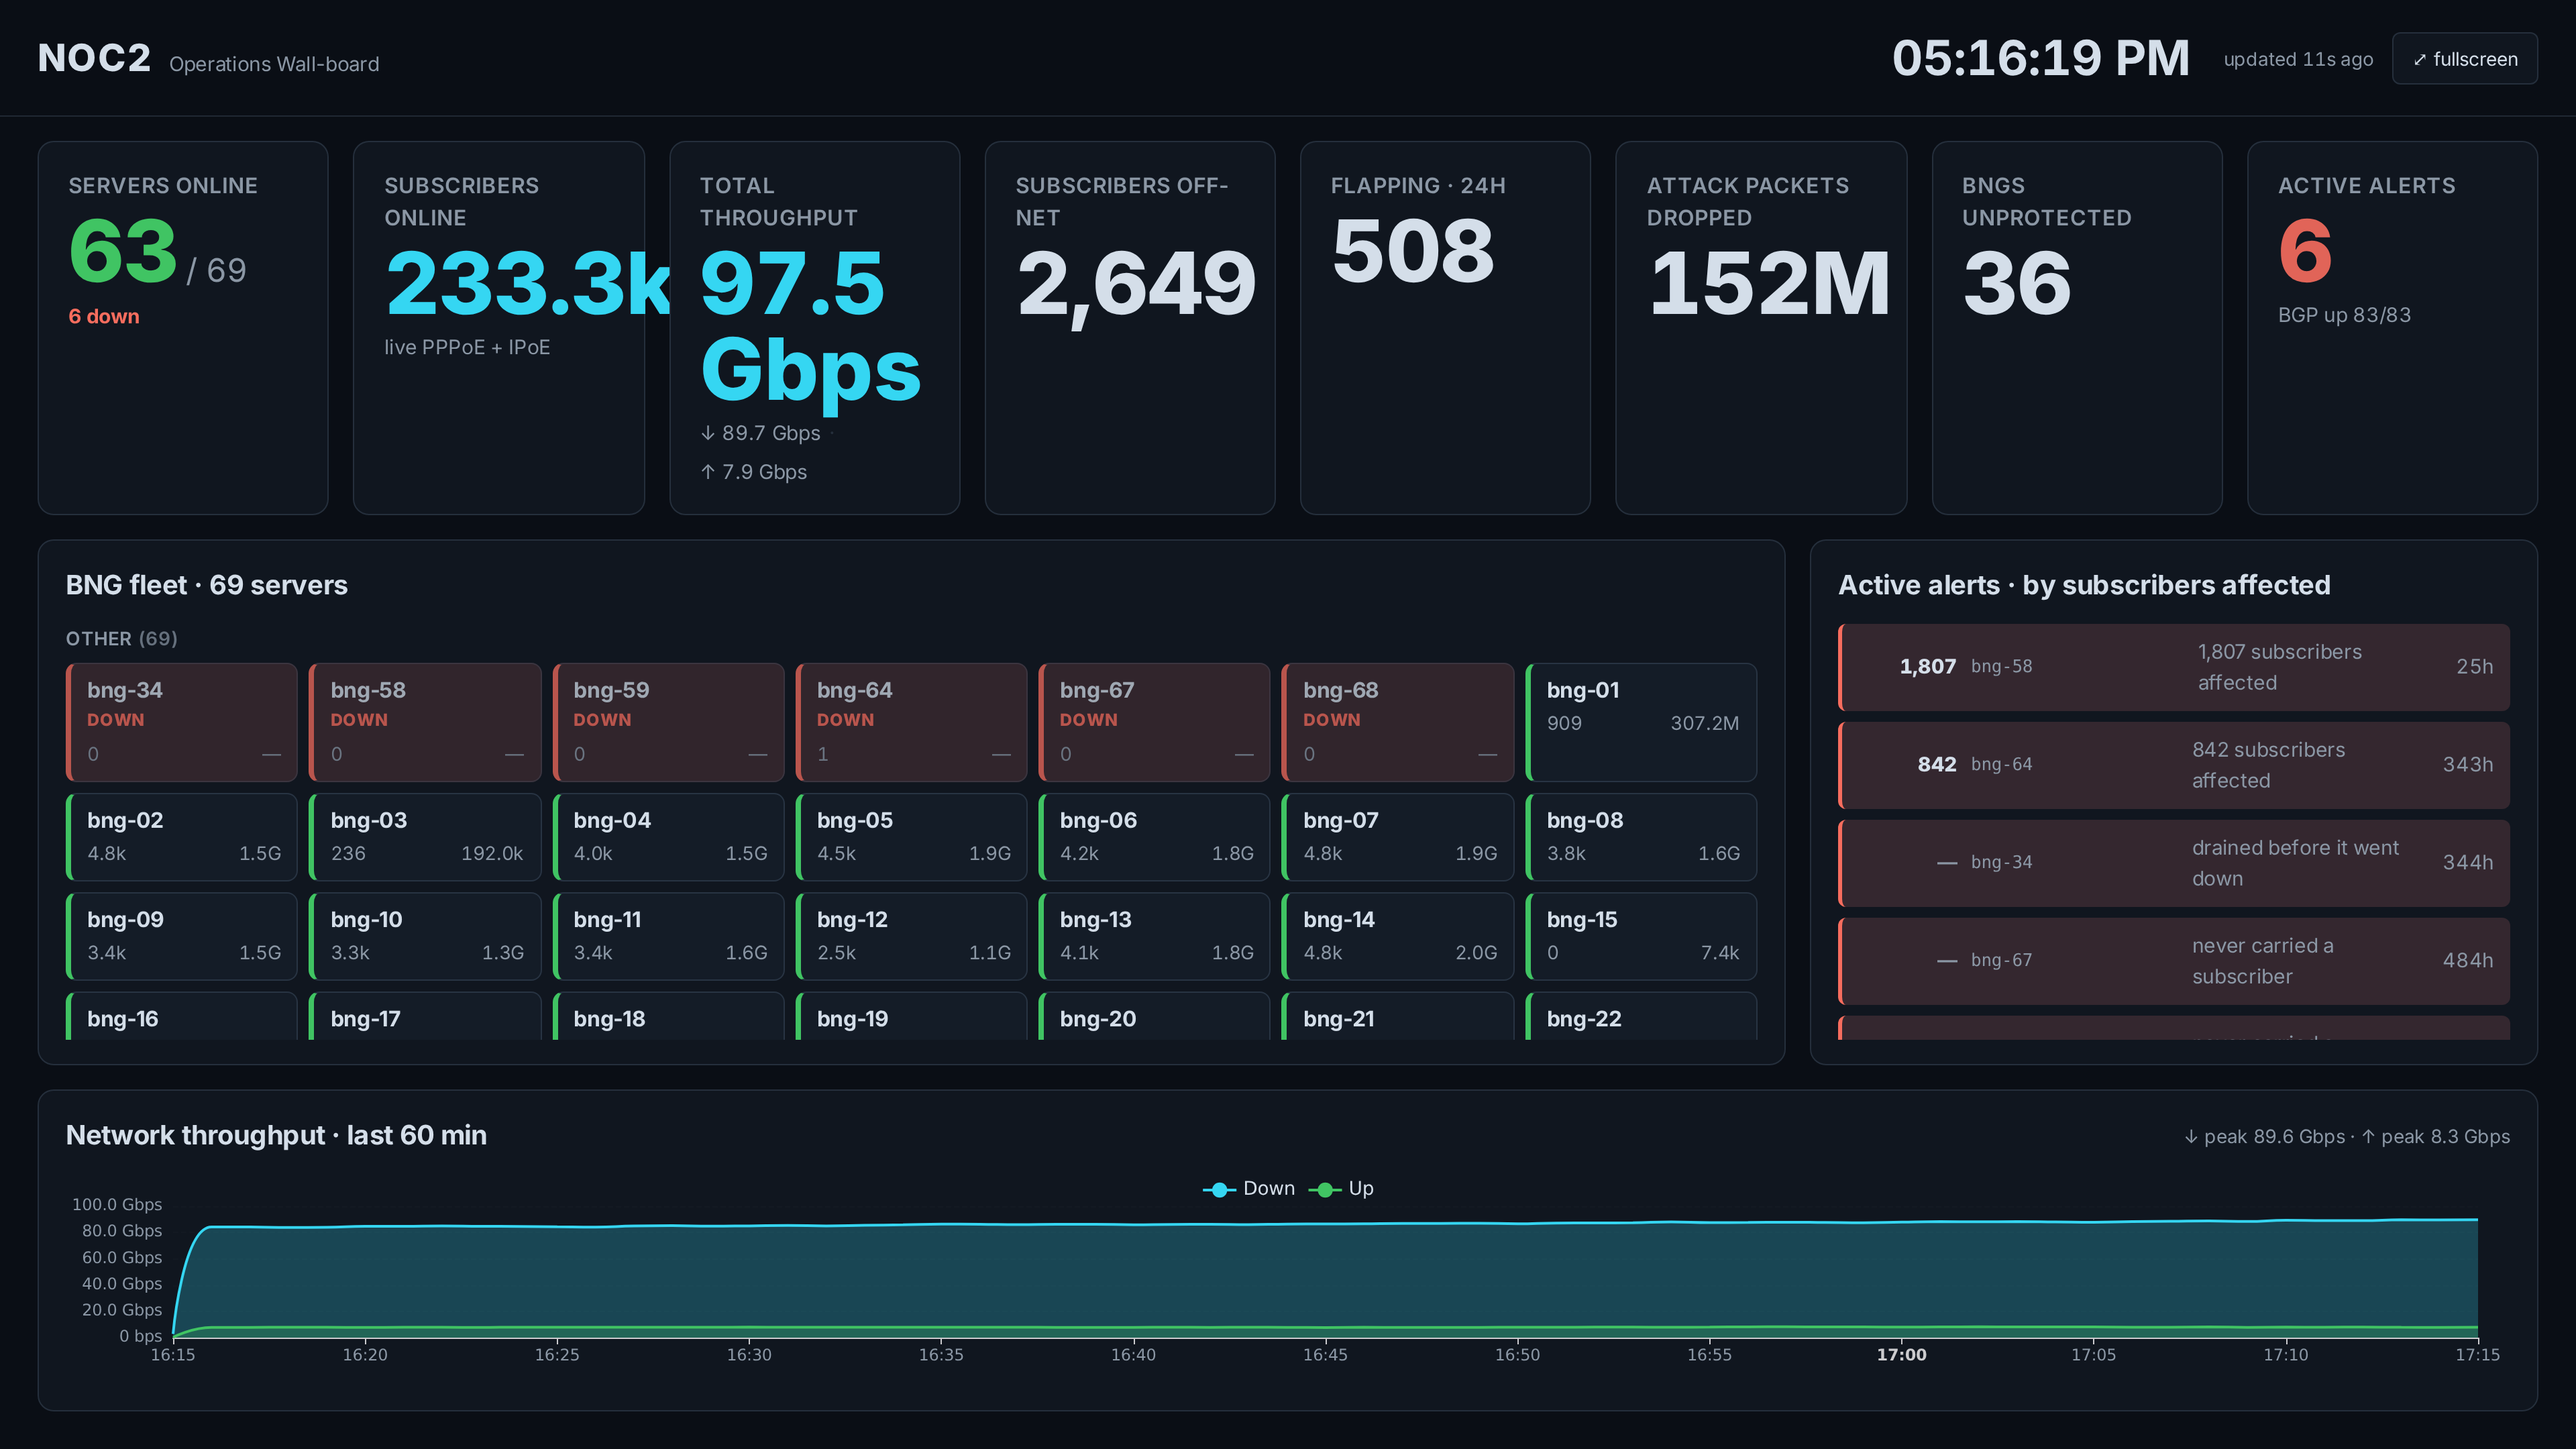
The same measurements drive a wall-board built for a television: gateways by state, active outages ranked by subscribers affected, attack traffic absorbed, and throughput over the last hour. It shows unresolved conditions regardless of age, because an incident that has been running for two days is exactly the one that should stay on the wall.
What the numbers will and will not do
Measured, not inferred
Availability comes from counting the intervals a gateway actually reported, against the number it should have. Where a day was never measured it is excluded from the average — never counted as perfect uptime, which is the failure mode that quietly turns a report into fiction.
Silence is reported, not filled
Where a measurement is missing the platform says so. Cards state the share of signals available; lists state when a count has hit a cap and is therefore a floor rather than a total.
Severity follows impact
Acknowledging an alert records that a human has seen it. It does not make the condition less severe, and it does not remove the gateway from the wall-board. Planned work is recorded as planned work, with an end date, and excluded from the availability figures.
Precision is not invented
Where the sampling interval cannot resolve something, the platform ranks on what it can measure and says which is which. A forecast with too weak a fit produces a growth rate and no date.
The principle behind all of it. A monitoring platform is only useful if its numbers can be trusted when they are inconvenient. Every figure in NOC2 is shown with the measurement behind it, the coverage it was computed over, and an honest gap where the data does not exist — so that when the score is poor, the argument is about the network rather than about the tool.
Getting started
Install
One agent per gateway, enrolled with a key. It begins reporting within a minute and updates itself thereafter over a signed channel.
First useful day
Live state, sessions, alerts and protection posture are available immediately. Availability and growth figures become meaningful as history accumulates; trend-based forecasting waits for a fortnight of data rather than guessing from three days.
Hand it out
Give the support desk the subscriber view, the NOC the wall-board, and management the health score and monthly report. Downstream operators get a login scoped to their own gateways.
About the screenshots. Every image in this document is a real screen from a production deployment. Operator
names, gateway hostnames, site names, subscriber identifiers, service names, IP addresses (v4 and v6) and MAC
addresses are replaced with placeholders before the page renders, so no customer-identifying value appears in any
image. Addresses shown use the RFC 5737 and RFC 3849 documentation ranges. All measurements, counts, percentages and
timings are unmodified.
Trademarks and non-affiliation. Cisco, IOS XR and ASR are trademarks or registered trademarks of Cisco
Systems, Inc. Nokia and 7750 SR are trademarks or registered trademarks of Nokia Corporation. MikroTik and RouterOS
are trademarks of Mikrotikls SIA. BNGSOFT is not affiliated with, endorsed by or sponsored by any of them, and names
are used for identification only.