
Broadband Gateway · CGNAT · QoS · Protection
"Is It Them, Their Line, or Us?" — Answered in One Search
search
or MAC — whatever they can give you
intermittent line cannot hide
on request, not a cached copy
theirs
from the internet path
Most subscriber tooling answers a different question than the one the desk is asking. It will tell you whether a session exists, how many bytes it has moved, and which port it landed on. All true, and none of it distinguishes a customer whose wifi is congested from a customer whose line is flapping from a customer sitting behind an overloaded gateway. Triage is built around that distinction, because it is the one that decides whether a van gets dispatched.
What the page already knows before you click anything
Type an identifier and the answer opens with a plain-language verdict rather than a wall of counters. Behind it sit the facts that produced it:
- Live session state and uptime
- Interface, VLAN, address, MAC
- Current up/down rate and totals
- Which gateway is serving them
- Reconnects over the last 24 hours
- And over the last 7 days
- A steady session and a line that reconnected 500 times look identical in a snapshot — not here
- Health of the serving gateway
- Open faults on that gateway
- If the node is unhealthy, one call is the tip of a much larger problem
Live diagnostics, read from the gateway on request
Everything above comes from records the platform already holds. The panel below does something different: when the agent asks for it, the gateway is queried directly, and the answer describes the subscriber's experience as the forwarding plane sees it at that moment.
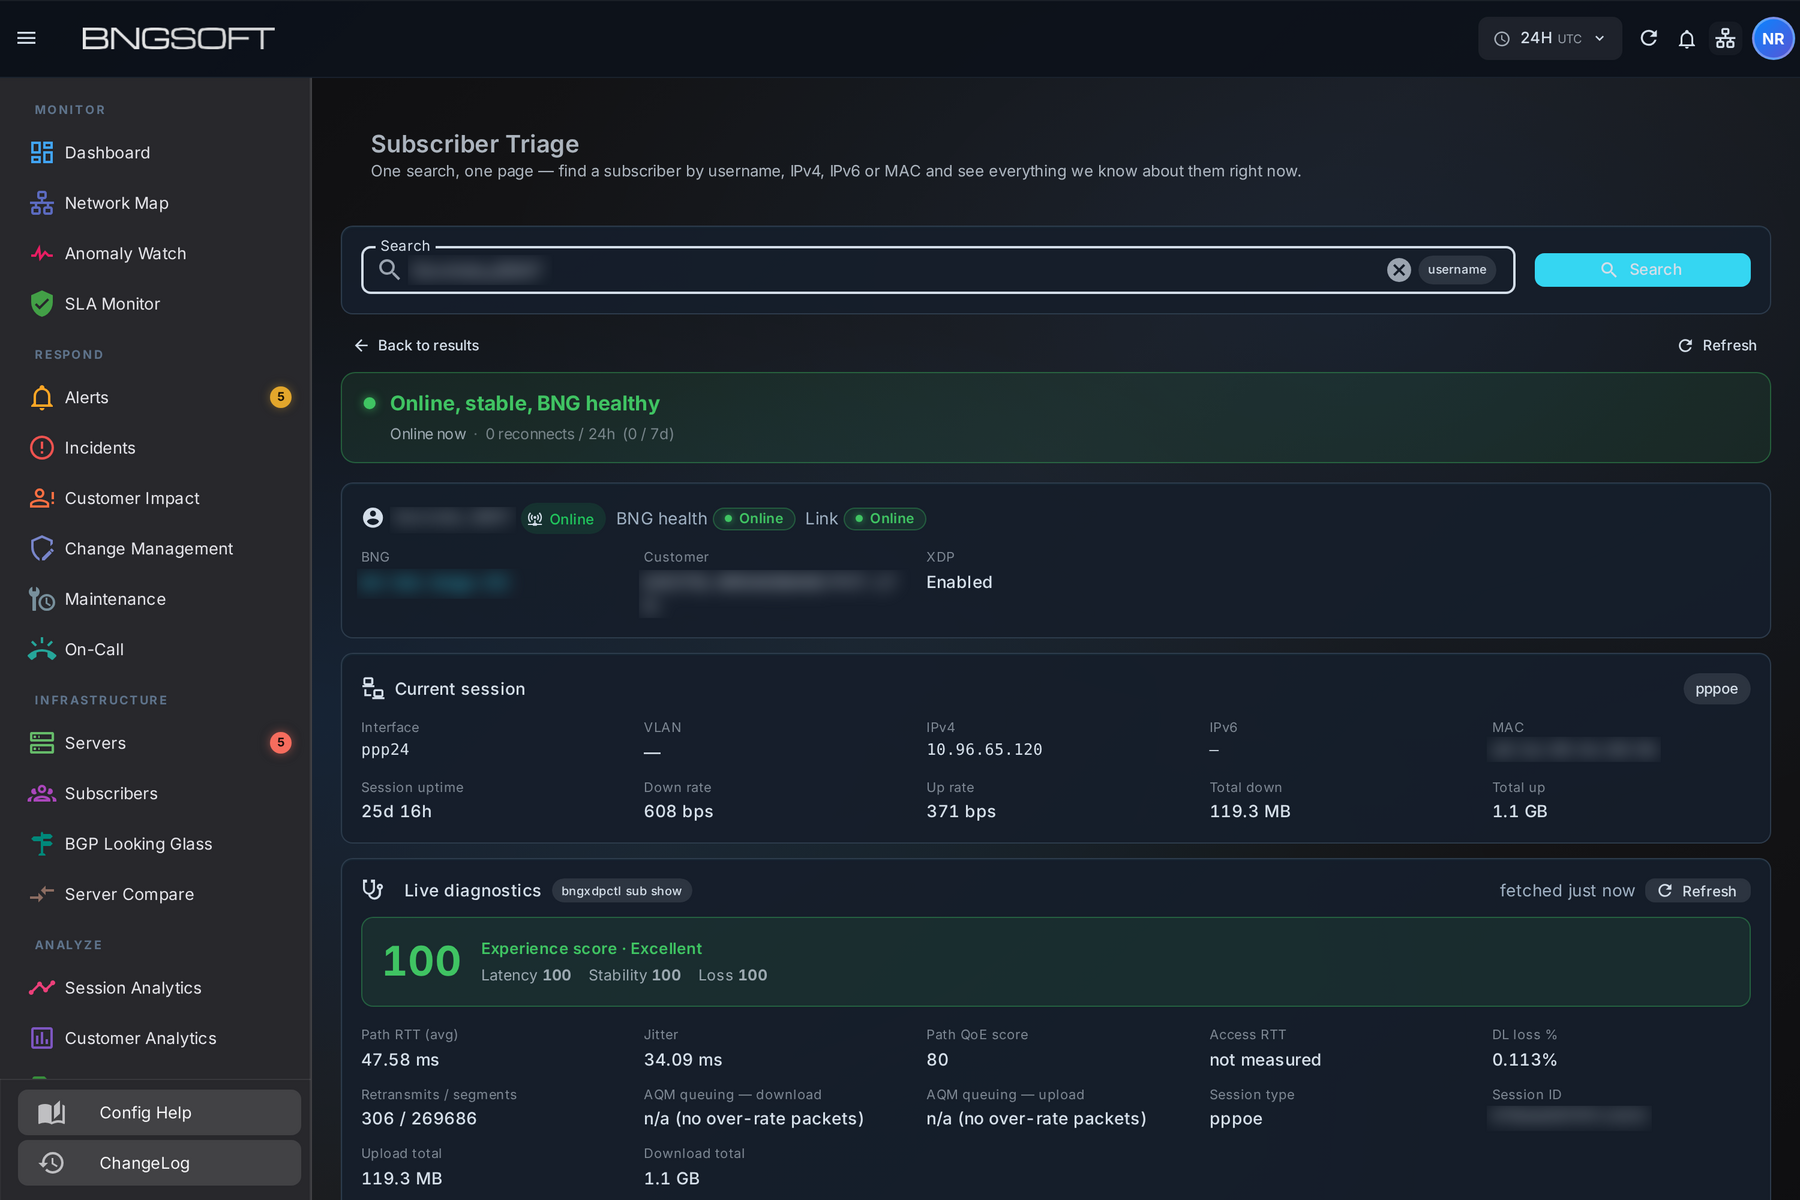
- An overall experience score
- Broken into latency, stability and loss
- So "it feels slow" resolves into which of the three is actually degraded — or none of them
- Round-trip time and jitter
- Download loss, with the retransmit and segment counts behind the percentage
- Access-leg round trip where the equipment can measure it
The distinction that decides who owns the fault
Latency is not one number. A subscriber's round-trip time is partly the internet path to wherever they are connecting, and partly the delay the operator's own shaper adds when the subscriber is over their rate. Those two have completely different owners, and averaging them together tells you nothing about which.
Internet path
Round-trip time and jitter to the far end. Rises when the destination is distant, congested, or the transit provider is having a bad day. Not something the operator can shape away — and not a reason to send a van.
Our queuing
Delay added by the operator's own shaper when the subscriber exceeds their rate. Reported separately, with the over-rate packet count behind it. This is the part the operator controls, and the part worth acting on.
Reporting these apart is what lets an agent say "your line is fine, the service you're connecting to is slow" with something behind it — or escalate internally when the delay really is being added on the way out.
What it says when it does not know
A diagnostic tool earns trust by being clear about the edges of its own knowledge. Several readings are only available on some hardware, in some modes, or only once there is traffic to measure. In every one of those cases the page says so, rather than printing a zero.
| Reading | When it cannot be measured | What the page shows |
|---|---|---|
| Queuing delay | No packets have exceeded the subscriber's rate, so the shaper has added nothing to measure | n/a (no over-rate packets) — never 0 ms, which would read as "measured, and perfect" |
| Access-leg round trip | The access equipment has not returned enough samples | not measured — distinct from a genuine zero |
| Address translation | The gateway runs in a mode where translation is not part of its job | Reported as not configured on that node — a normal state, not a fault |
| The gateway itself | The node is unreachable at the moment the agent asks | Says the gateway could not be reached, and shows nothing else — an unreachable node never renders as a healthy subscriber |
Works the same on both kinds of gateway
Not every node in a network does the same job. Some perform address translation for subscribers behind shared addresses; others handle only rate control and queuing. Triage reads whichever is present and describes the node it is actually talking to — translation state where translation runs, and a clear "not configured on this node" where it does not. There is no separate tool for each kind of gateway, and no configuration for the desk to get wrong.
What the incumbents give a support desk
None of this is a claim that other platforms cannot see a subscriber. They can — often in more depth than we do at the packet level. The difference is who assembles the answer. On a chassis BNG the per-subscriber picture is spread across a CLI session, RADIUS accounting, SNMP counters and flow export, and turning that into "is it them or us" is an integration project the operator scopes, funds and maintains. The desk does not get a verdict; it gets raw material.
| The desk asks | Typical chassis / router workflow Cisco ASR 9000 · Nokia 7750 SR · MikroTik RouterOS |
BNGSOFT Subscriber Triage |
|---|---|---|
| "Find this customer" | Identifier-dependent. A username lands in one system, an address in another, a MAC in a third. The agent must know which tool answers which question. | One field. Username, IPv4, IPv6 or MAC all resolve to the same page. |
| "Has their line been dropping?" | Available from accounting records or logs, if retained and if someone builds the query. Rarely in front of first line. | Reconnect counts over 24 hours and 7 days, on the page, unasked. |
| "Is it our fault?" | Queue and interface counters exist per subscriber or per queue. Relating them to that subscriber's felt latency is manual analysis, usually second line or later. | Queuing delay the shaper added is measured and reported separately from internet-path round trip. |
| "What is their experience right now?" | Inferred from counters, or measured by a separate probe or assurance product, licensed and integrated on top. | A live read from the forwarding plane, on request, in the same page. |
| "Is this reading real?" | A counter reads zero whether the condition was absent or never sampled. The distinction lives in the reader's expertise. | Unmeasured states are labelled as such and never rendered as a zero. |
What changes for the desk
- Provisioning for the account
- A gateway console for the session
- A monitoring system for the node
- Correlated by hand, while the customer waits
- Any identifier the caller can give
- Verdict first, evidence beneath it
- Live gateway reading on request
- Escalate with numbers attached
- Faults on the operator's side are identified as such, not dispatched
- Intermittent lines stop hiding behind a healthy-looking snapshot
- Second line receives a diagnosis, not a transcript
Trademarks and non-affiliation. Cisco, IOS XR and ASR are trademarks or registered trademarks of Cisco Systems, Inc. Nokia and 7750 SR are trademarks or registered trademarks of Nokia Corporation. MikroTik and RouterOS are trademarks of Mikrotikls SIA. BNGSOFT is not affiliated with, endorsed by or sponsored by any of them, and names are used for identification and comparison only. The comparison above describes typical operator workflow on those platforms rather than any specific release or feature set — capabilities vary by version, licence and deployment, and the vendors' own documentation is the authority on what their products do.