
Stop planning uplinks with a contention ratio.
Here is what a subscriber actually uses.
Busy-hour demand per subscriber, measured across 63 production gateways at eight independent operators: a median of 3.21 Mbps, with eighty percent of gateways falling between 2.66 and 3.65. Not a plan speed, not a model, not a ratio — the number the interfaces reported.
A contention ratio is a statement about what you sold. It is not a statement about what anybody uses. The gap between those two is where uplink budgets are won and lost, and it is measurable — so we measured it.
The distribution
Every gateway's busiest hour over three days, divided by the subscribers on it. Sixty-three gateways, eight operators, different countries, different access technologies, different tariffs.
p10
p25
p75
p90
61 of the 63 gateways, in quarter-megabit bins. Two gateways are omitted from this chart because they carry transit traffic across the same interfaces — the outlier explained further down. Nearly half the fleet lands in a single bin.
The striking thing is not the median. It is how narrow the band is. A one-Mbps spread from the tenth percentile to the ninetieth, across operators that have nothing in common but the software they run. Subscriber demand at the busy hour behaves like a physical constant, not like a business decision.
Which means you can plan from it. Multiply your subscriber count by roughly 3.2 Mbps for the expected busy hour, and by 3.65 for a ninetieth-percentile case. Across this fleet that arithmetic would have sized every uplink correctly.
Why the usual method misses
Contention-ratio planning
Starts from the speed you sold — 300 Mbps, 1 Gbps — then divides by a ratio somebody chose years ago.
The sold speed has almost no bearing on busy-hour consumption. Raising a tariff from 300 Mbps to 1 Gbps does not triple what the household pulls at nine in the evening.
So the ratio gets adjusted by feel, and the uplink is over- or under-built by whatever margin that feel happened to carry.
Measured demand
Starts from what subscribers actually pulled, at the hour it mattered, on gateways in service.
Independent of tariff structure, which is why the band stays tight across eight operators with different products.
Recomputed continuously as the base grows, so the planning figure ages with your network instead of against it.
It scales with subscribers, and it scales cleanly
The companion measurement to this one correlated subscriber count against forwarded traffic across the same fleet. The relationship is r = +0.90 — subscribers predict traffic almost perfectly. That is what makes the number above usable: demand per subscriber is stable, so total demand tracks your base.
Uplink capacity
Subscriber count × 3.2 Mbps for the expected busy hour. Use 3.65 if you want to cover the ninetieth percentile.
Growth headroom
Demand per subscriber is stable, so added subscribers add predictable load. Your uplink question becomes a subscriber-forecast question.
Gateway CPU
The same study found no relationship between traffic and CPU consumed. Bandwidth is predictable; silicon is not. Measure that one on your own hardware.
The outlier that proves the method needs care
One gateway in the raw data reported 3,545 Mbps per subscriber — a thousand times the median. It is not a subscriber-demand figure at all: that box carries transit traffic across the same physical interfaces while terminating very few subscribers, so the division is meaningless.
We mention it because it is the failure mode of every per-subscriber statistic, and because a study that quietly dropped it would be less trustworthy, not more. Gateways below 1,000 subscribers or 100 Mbps are excluded from the percentiles above for exactly this reason.
What this does not claim
This is a measurement of eight operators running one forwarding platform, over three days, at each gateway's own busy hour. It is not a universal constant of the internet. Access technology, tariff mix, time zone and content-delivery arrangements all move the number — and the tight band here is partly a statement about how similar residential broadband demand has become, not only about these networks.
What it does establish is that the figure is measurable, stable, and worth measuring — and that a planning exercise built on a ratio rather than a measurement is guessing when it does not need to.
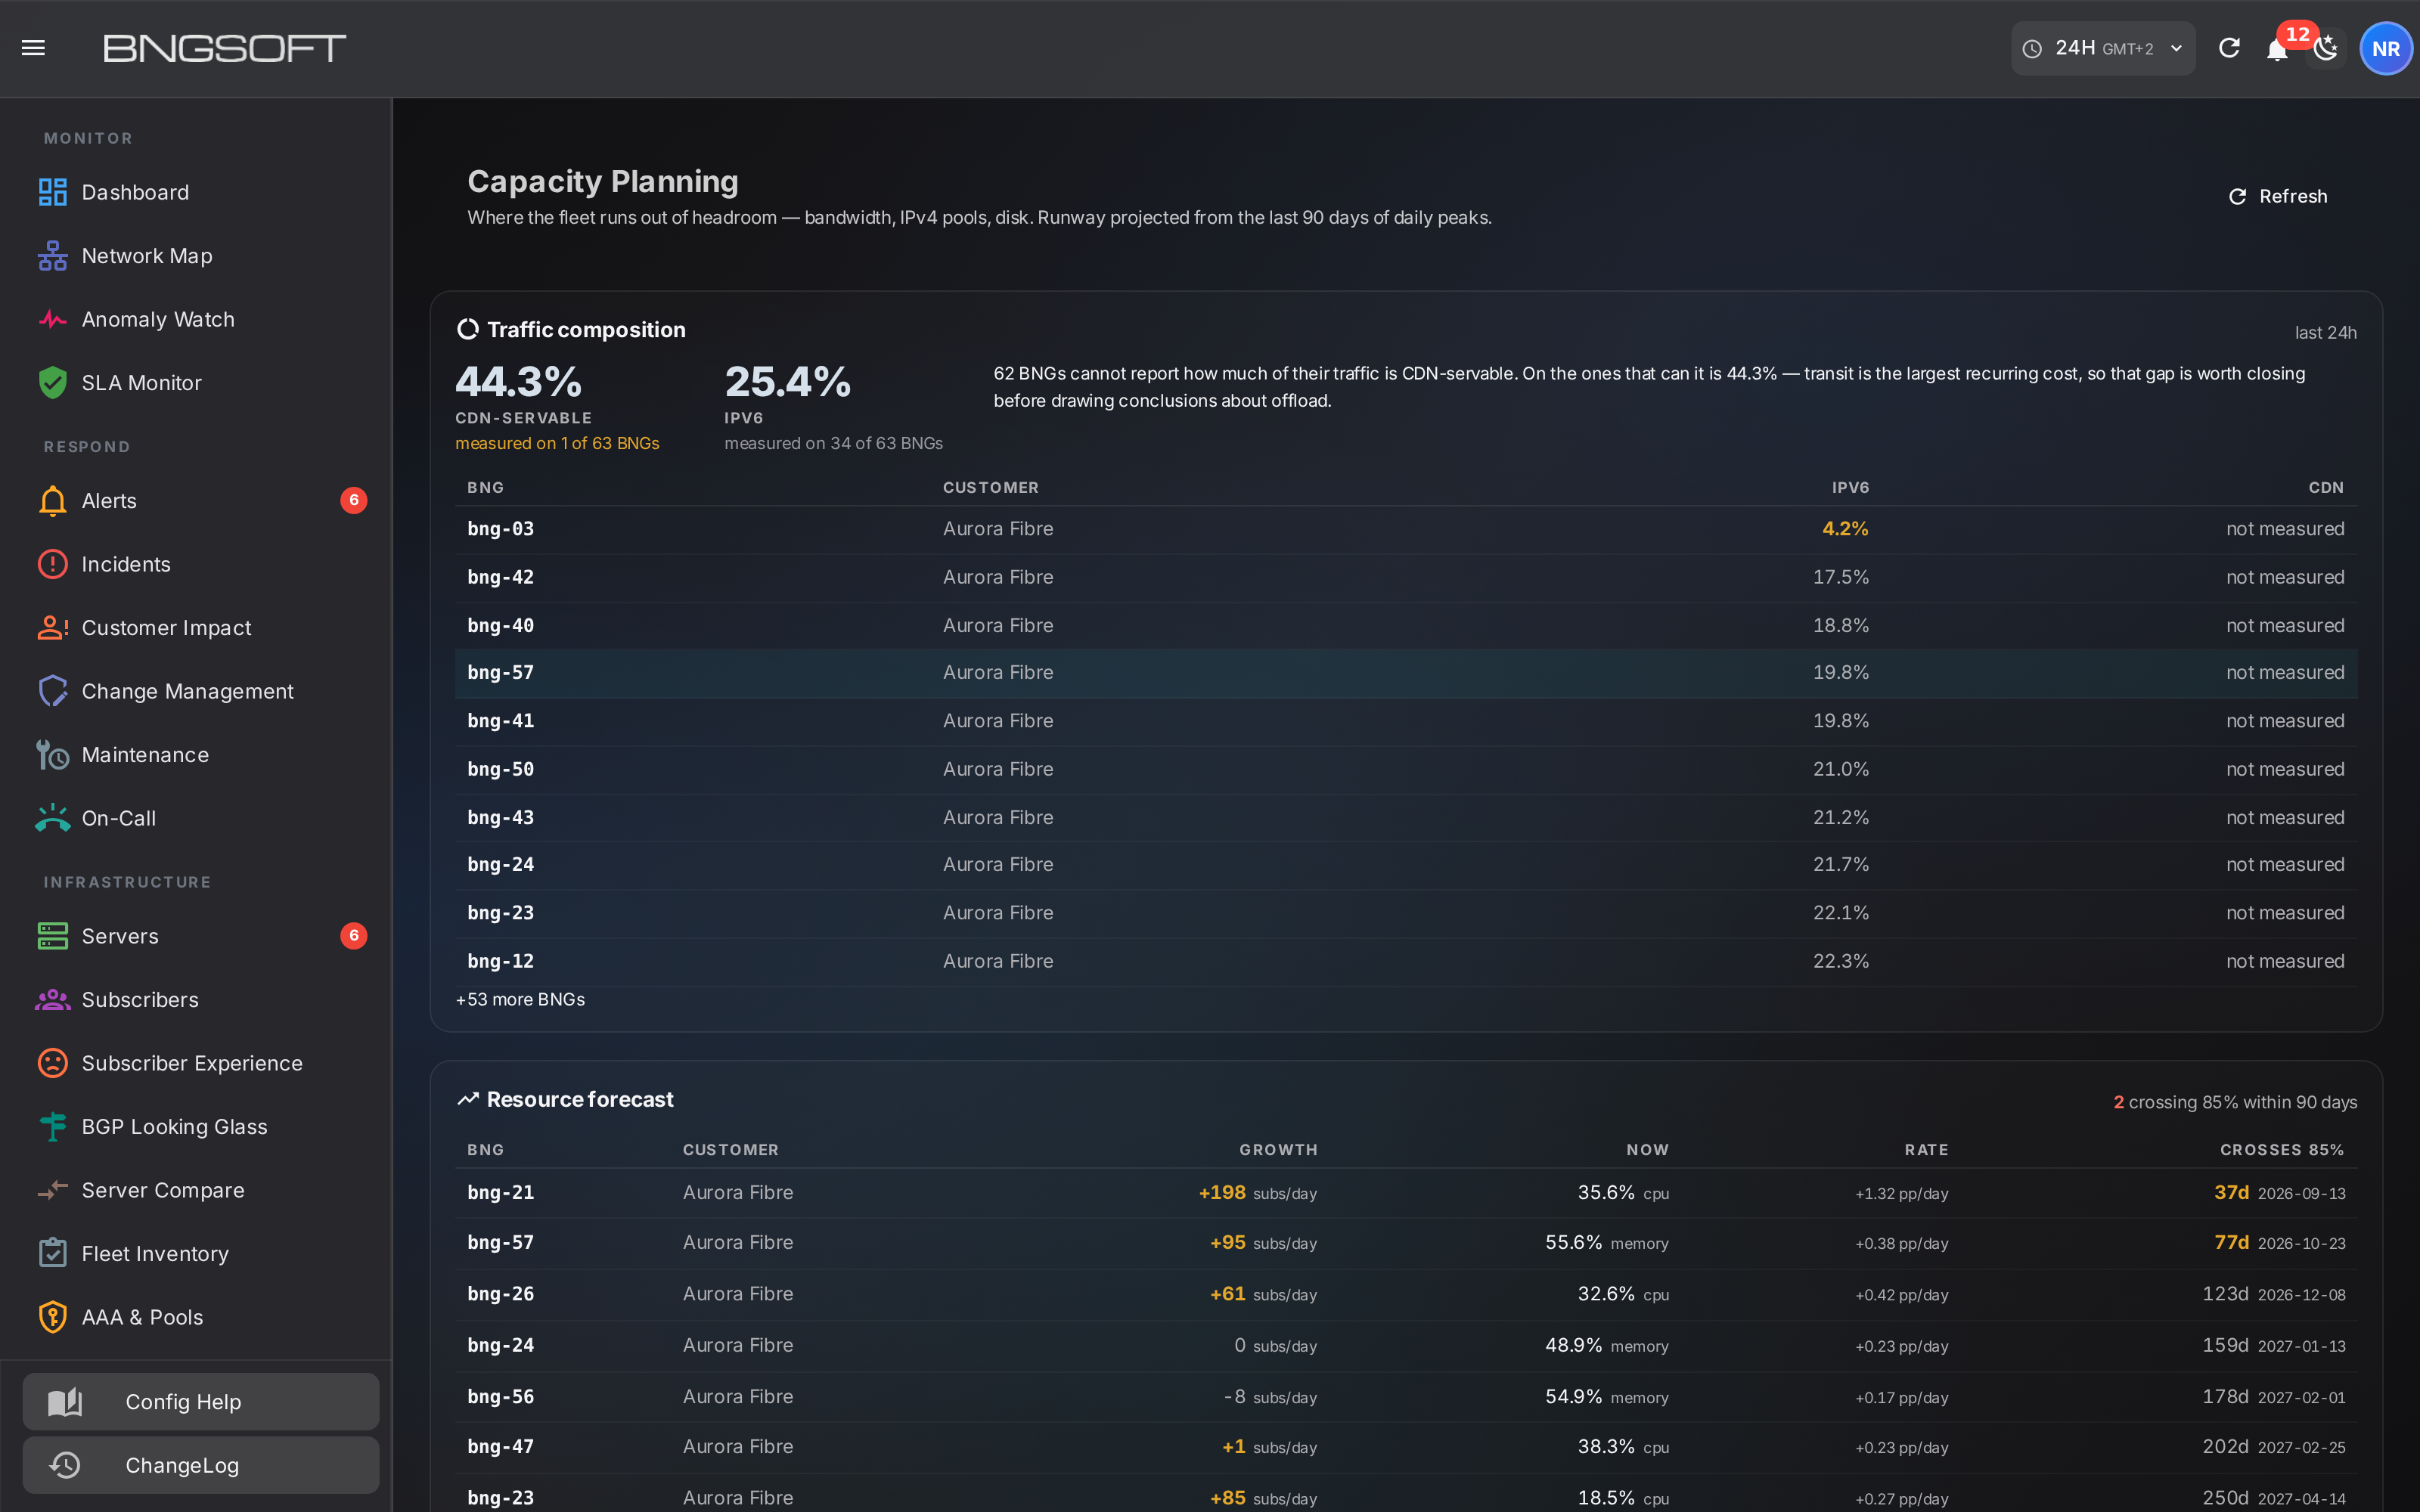
Every BNGSOFT gateway reports this continuously. Your own per-subscriber demand, at your own busy hour, per gateway — so the planning number you use is yours rather than ours.
About the data. Production telemetry from eight independent operators. No operator name, hostname, site, region or subscriber identifier appears in this document, and no per-operator figure is published. Method: for each gateway, hourly throughput is derived from interface counter deltas across physical interfaces only (bonded members excluded to avoid double counting), taking the busier direction rather than the sum of receive and transmit — a gateway forwards, so a packet appears once on ingress and once on egress, and adding them double-counts every forwarded packet. The busiest hour over three days is then divided by that gateway's subscriber count. Gateways with fewer than 1,000 subscribers or under 100 Mbps at peak are excluded. About the screenshots. Every screen shown is a real production console. Gateway hostnames are replaced with placeholders before the image is captured, and no operator name, site, region, subscriber identifier or address appears in any image. CPU models are left intact: they describe hardware, not a customer.