
Know before
the phone rings.
Every monitoring system can tell you a number. The useful question is the one an engineer actually walks in with: is my network all right, and if not, what do I do about it? This is the page that answers it — in a sentence, then in evidence, then in a name of who should act.
A monitoring screen that needs you to already know what is wrong in order to find out what is wrong has not saved you anything.
That is the honest failure of most NOC tooling. The data is all there — on the dashboard, the server list, the alert queue, the subscriber view — but finding it means knowing which of them to open first. The Operations Centre inverts that. It reads everything, decides what matters, and puts the answer at the top.
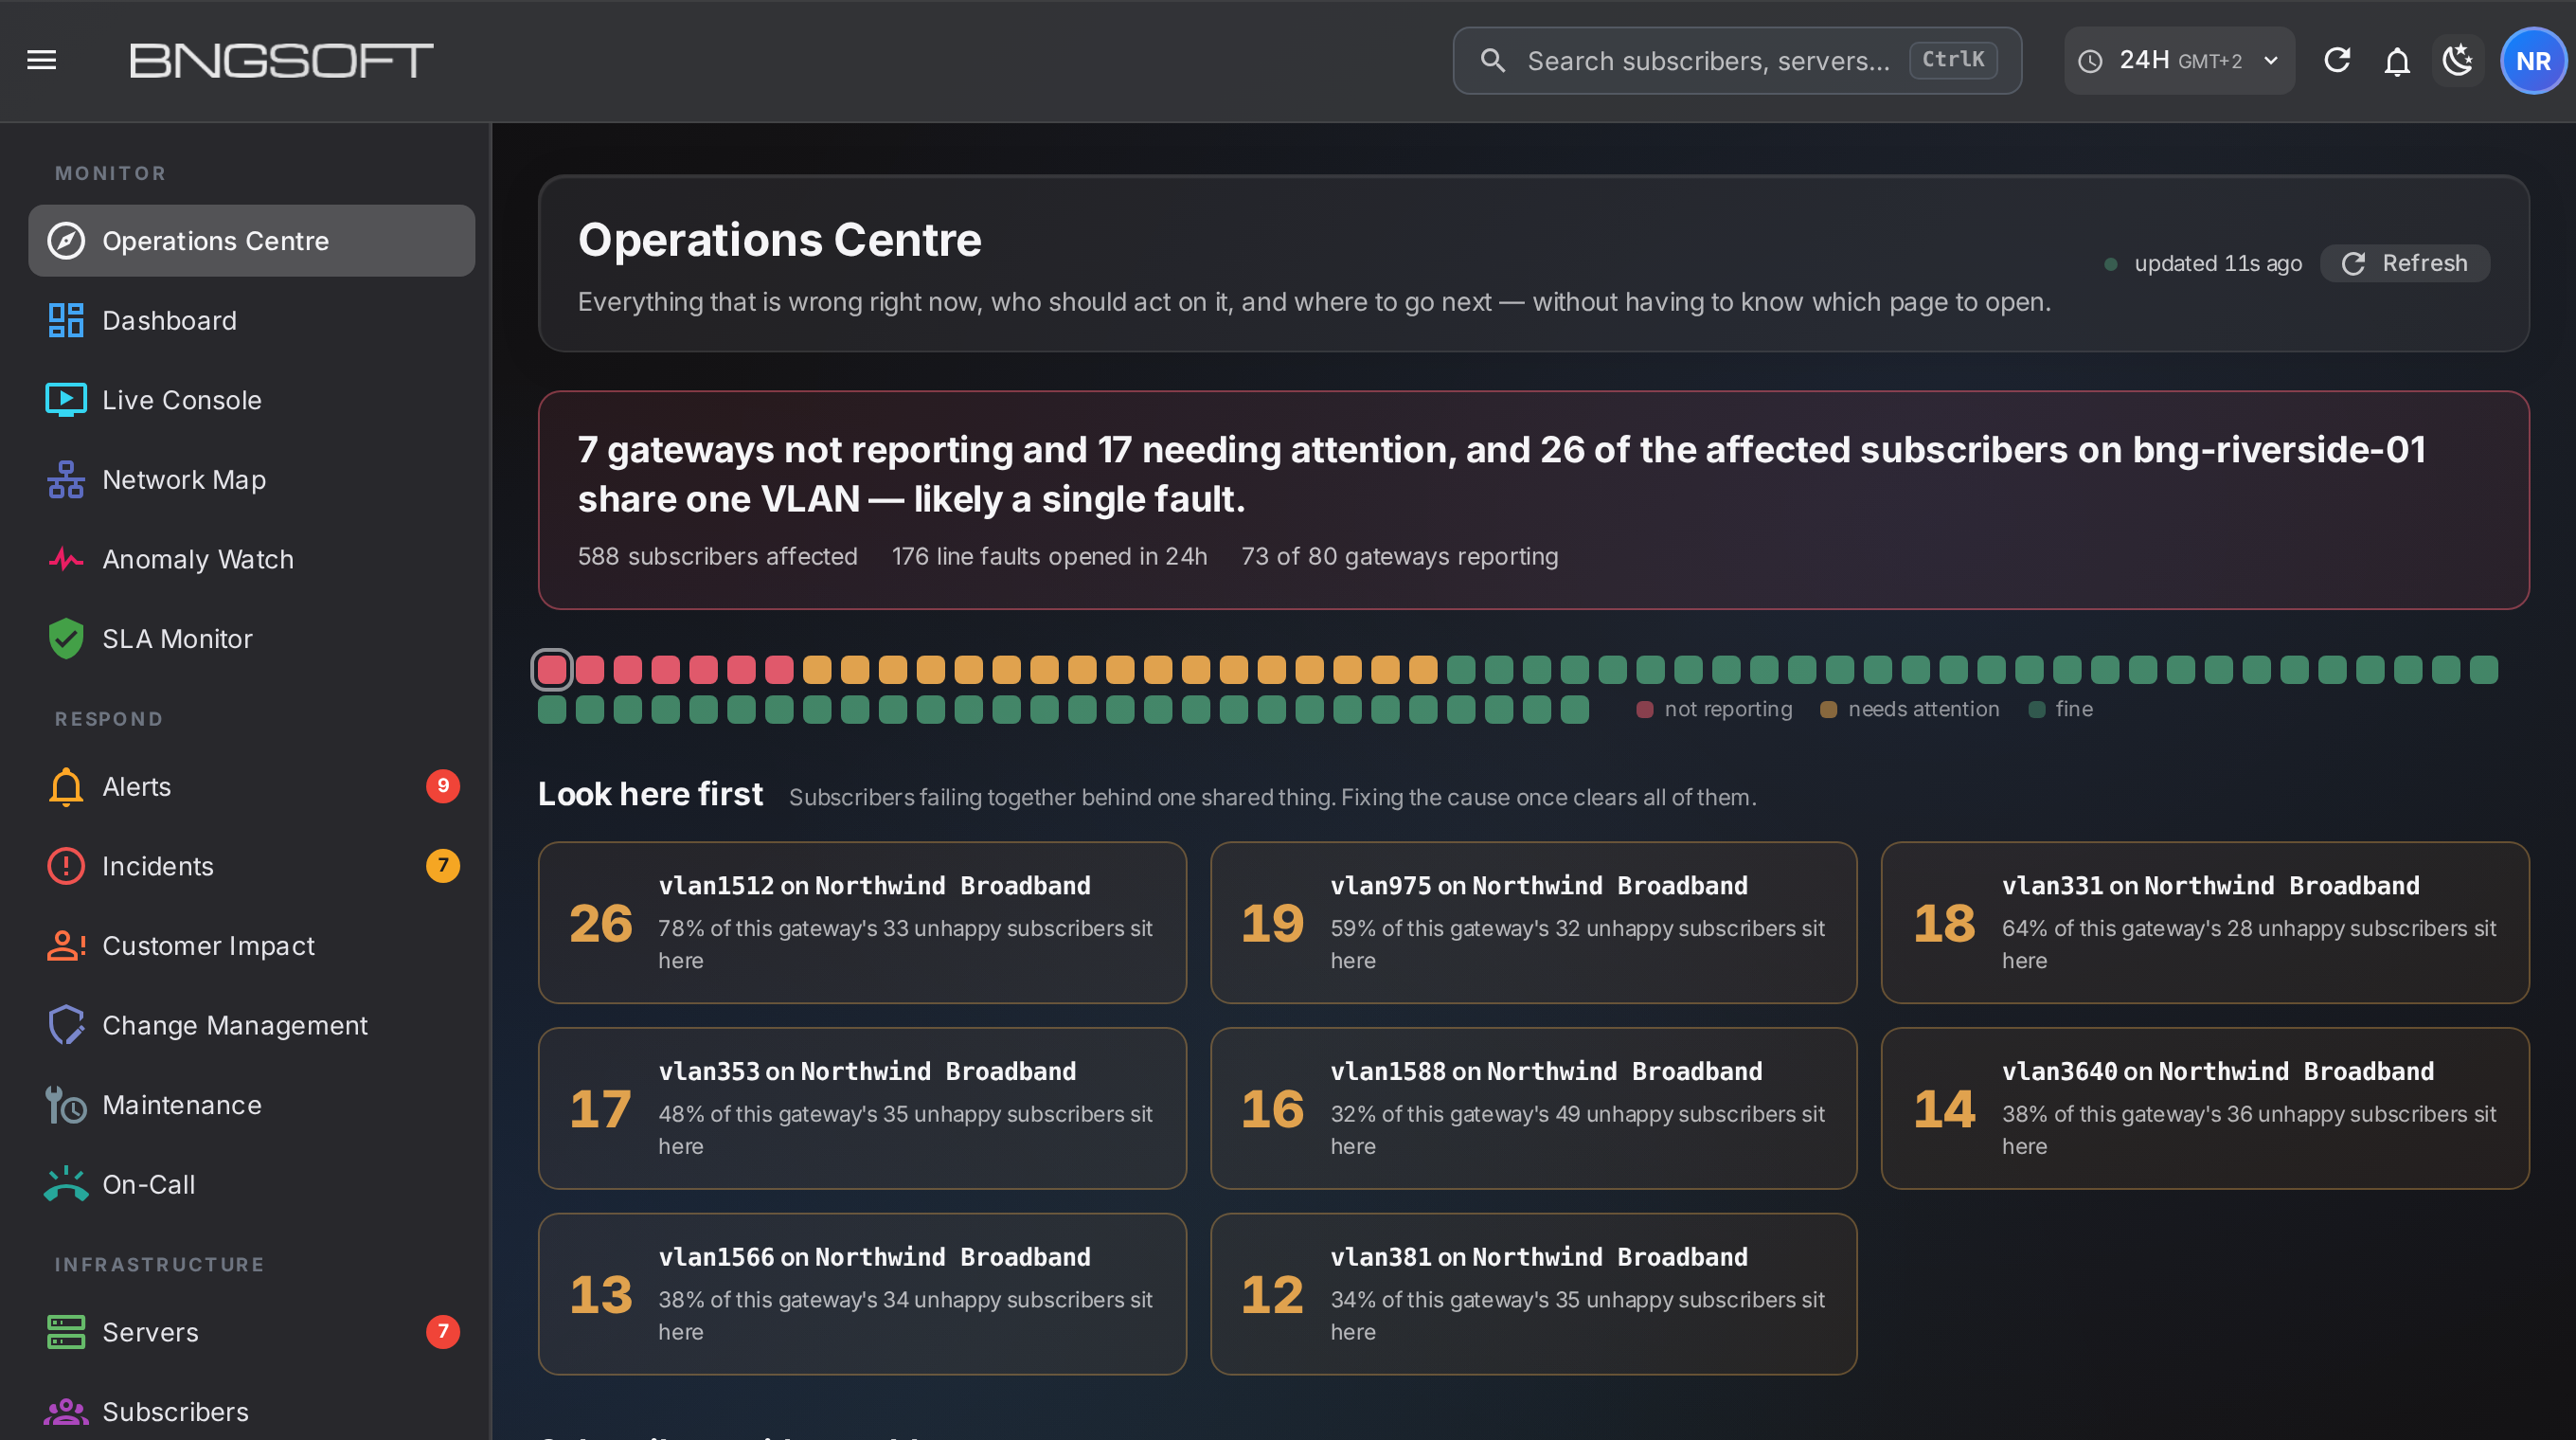
The sentence at the top
It is written from the current state every time, and it will not tell you things are calm when they merely look calm:
“7 gateways not reporting and 17 needing attention, and 26 of the affected subscribers share one VLAN — likely a single fault.”
Three separate facts, ranked. A gateway that stopped talking to us is listed first, because its state is unknown — and unknown is not the same as healthy. That distinction runs through every screen in this system and it is the reason the numbers can be trusted.
A silent gateway is the most dangerous kind. It reports no CPU spike, no faults, no unhappy subscribers — so on a conventional dashboard it renders exactly like a healthy one. Here it is red, it is first, and it says how long it has been quiet. On one live estate this surfaced boxes that had been silent for 12, 25 and 65 days.
One cause, many tickets
When an aggregation switch, an OLT or a backhaul link starts misbehaving, it does not announce itself. It arrives as a dozen unrelated-looking complaints over an afternoon — each one triaged separately, each one a candidate for a truck roll.
The rule is deliberately conservative. A handful of subscribers spread evenly across many VLANs is not a shared fault and is not reported as one. A concentration has to be real before it is shown, because an indicator that lights every night teaches people to ignore it.
Every problem names who should act
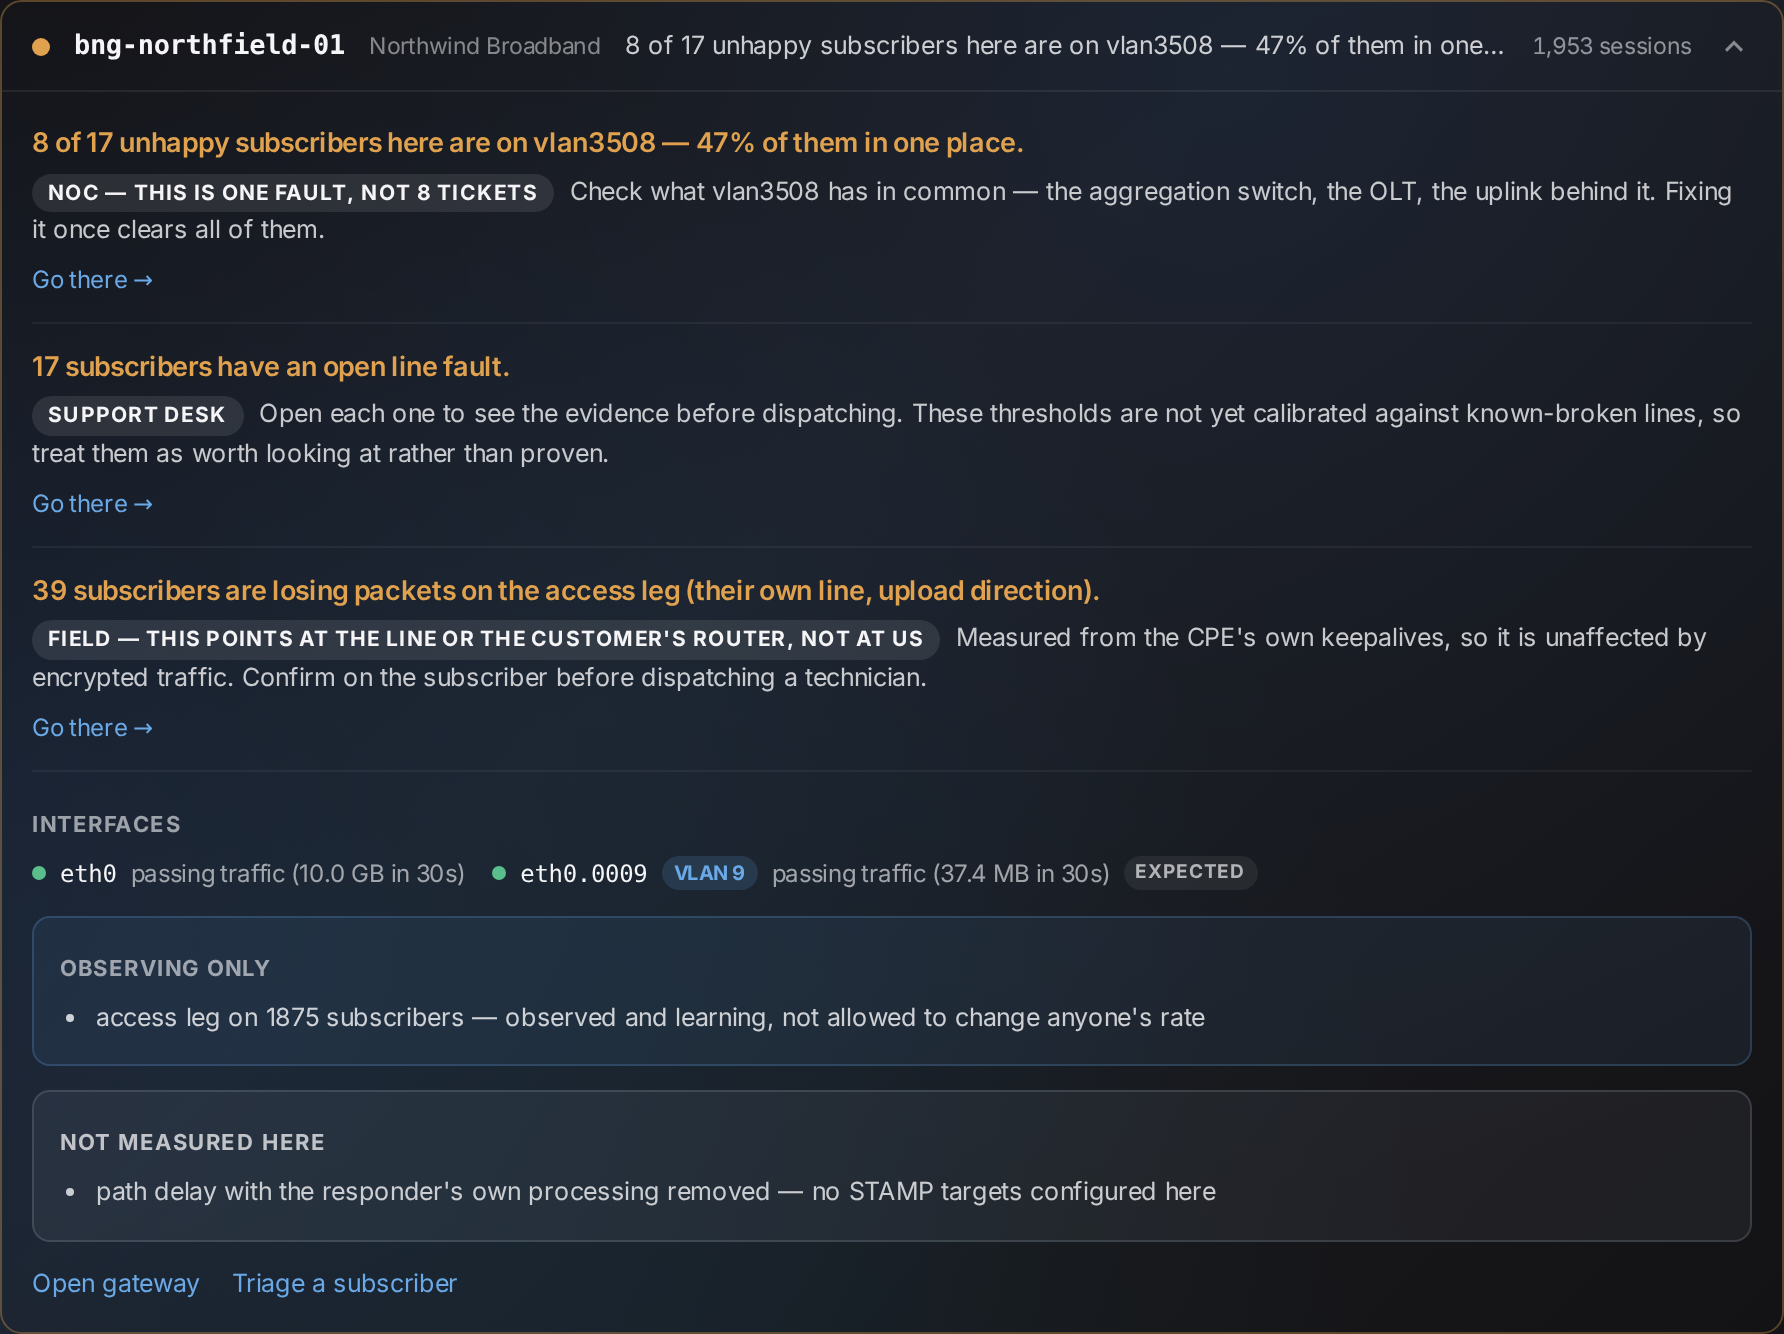
“High latency on gateway 4” is a measurement. It is not an instruction. Every finding here carries four things — what is wrong, since when, who it belongs to, and what to do next — and the mapping from evidence to instruction is fixed, so the same evidence always produces the same answer.
| What the evidence shows | Who it is routed to | Why |
|---|---|---|
| Access leg losing packets | Field technician | Measured from the customer router's own keepalives — it points at the line or the home, not at us |
| Our uplink slow against its own floor | NOC | The segment we own. Affects every subscriber on the box at once |
| Beyond our uplink slow | Transit provider | Upstream of us. No amount of work on the gateway will clear it |
| Many subscribers on one VLAN | NOC, high priority | One fault, not many tickets — the aggregation or OLT behind them |
| Gateway not reporting | You, or whoever runs the machine | State is unknown until it speaks again — everything shown is the last thing we saw |
| Neither leg measurable | Nobody yet | Said plainly, so it is not mistaken for a clean result |
The subscribers, and which way they are heading
A count of affected subscribers tells you less than it appears to. Two hundred holding steady and two hundred climbing are different nights, and only one of them needs somebody now.
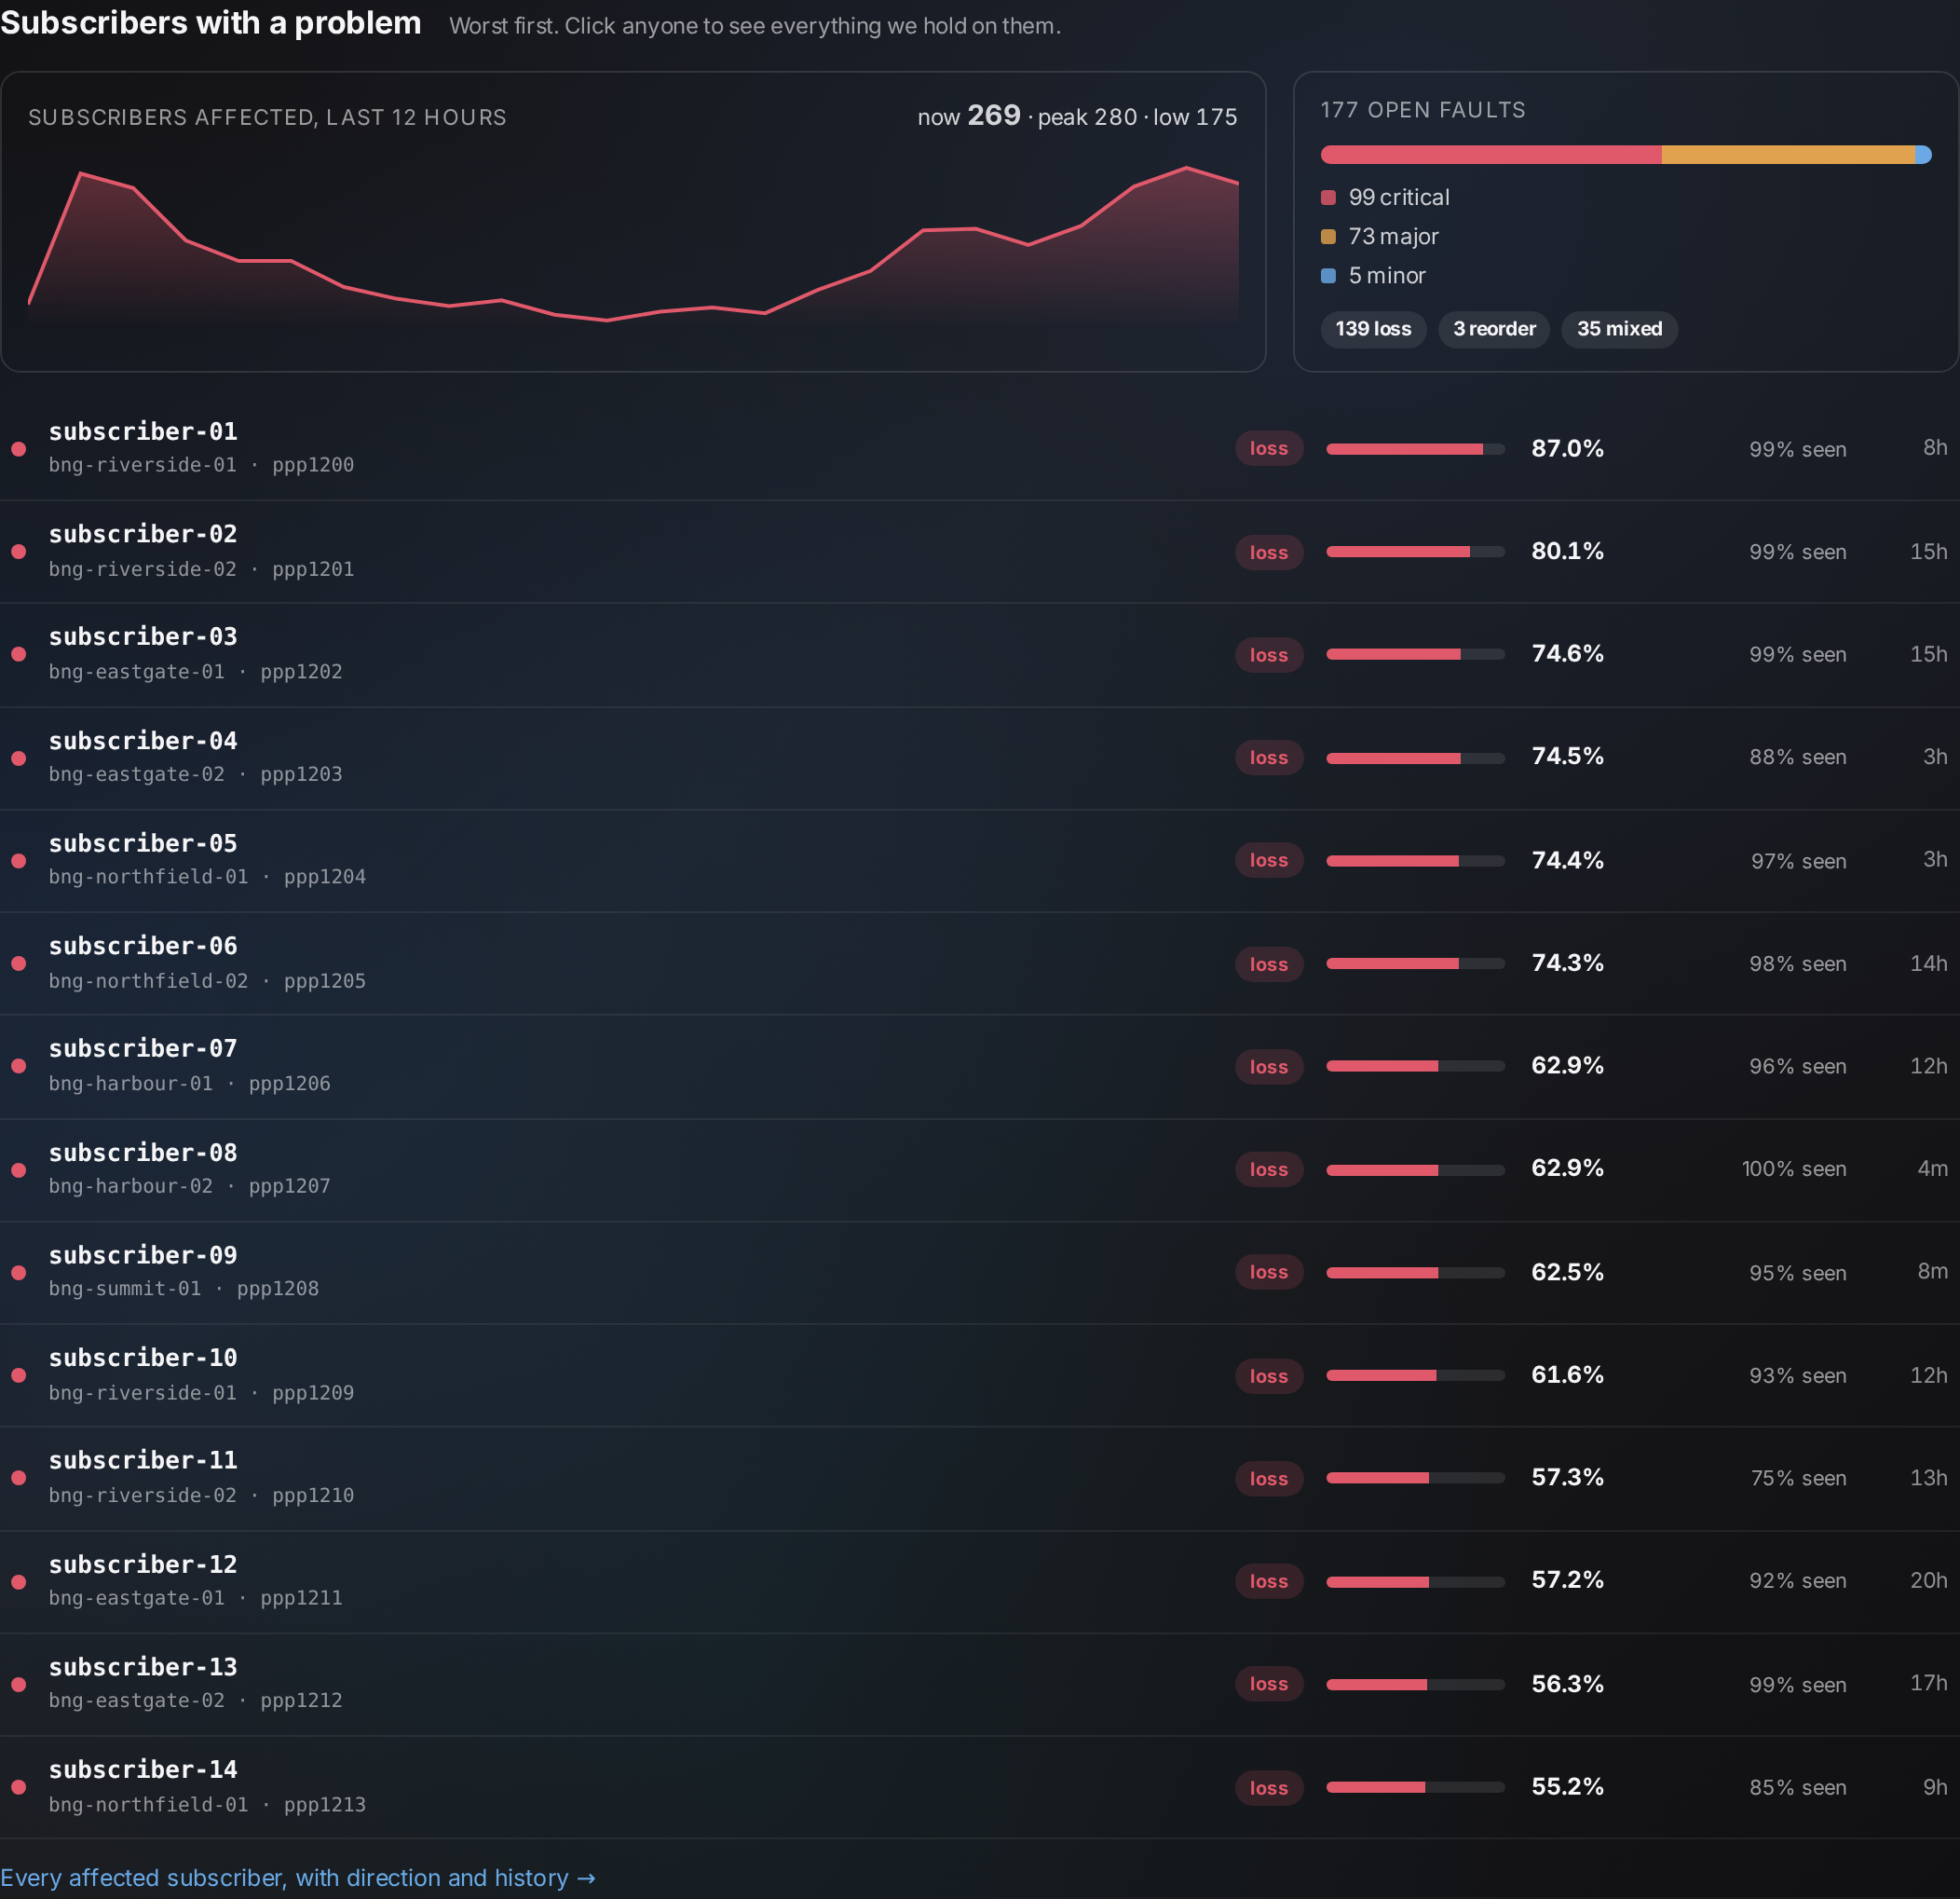
Every row opens a card carrying everything held on that subscriber — which gateway and interface, how much loss, how much of their traffic could actually be measured, how long it has been open, how many times it has come back, and the gateway's own live verdict. One click, without leaving the page.
Working with it, hour by hour
Open it, read one sentence
If the night is quiet it says so. If it is not, the sentence already contains the count, the worst thing, and whether a single cause explains a group of it.
Scan the strip
One square per gateway, worst first. Hovering names the box and its headline; clicking jumps straight to it. This is the whole estate in one glance, at any size of network.
Look at shared causes before individual ones
If a cluster is listed, start there. Fixing it once removes a group of tickets that have not all been raised yet.
Act on the badge, not on your judgement of the number
Field, NOC, or upstream — the finding says which, with the evidence beside it, so the decision does not depend on who happens to be on shift.
Call the customer before they call you
The subscriber list is worst-first and carries direction. A line at 60% loss climbing 17% an hour is a call you can make now, with the evidence already in front of you.
Without it
- The subscriber notices first and calls
- Each complaint is triaged on its own
- A shared fault looks like a run of bad luck
- A silent gateway looks healthy
- “Is it us or them?” is settled by argument
- Unmeasured subscribers are filed as fine
With it
- The degradation is on screen while it is still building
- The group is named before the second call arrives
- One cause, one fix, one line in the log
- Silence is red, first, and timed
- The segment at fault is measured and named
- Unmeasured is its own state, and it is shown
What it will not claim
The most valuable section of an operations screen is the one that admits its limits, because everything else on the page depends on it being honest.
Thresholds are described as what they are. The per-subscriber limits are drawn from the shape of a healthy population, not from lines known to be broken. So a crossing is presented as worth looking at rather than as a diagnosis, and the screen says so where an engineer will read it. When a signal is being learned but is not yet allowed to change anything, that is shown too — as observing only, not hidden behind a confident colour.
What it runs on
The Operations Centre is part of the BNGSOFT NOC platform and reads the gateways you already run. There is nothing to deploy alongside it, no collector to maintain, and no per-subscriber agent. Each operator sees their own gateways and their own subscribers, and nobody else's.
Reads what the BNG already knows
Error budgets, saturation, self-tests, per-VLAN concentration, path measurements and per-subscriber line quality — assessments the gateway computes for itself.
One request, cached
The whole page is a single aggregated call, scoped to your estate. It refreshes itself every 45 seconds and shows the age of the reading, so a stalled page cannot pass for a calm network.
Nothing is a dead end
Every finding links to the screen that handles it — the gateway, the subscriber triage, the capacity view — so the front door stays a front door.
The goal is a shorter route from “something is wrong” to “this is who fixes it”. Everything on this page exists to remove a step from that route — and to refuse, out loud, to fill a gap in the data with a reassuring colour.
BNGSOFT · Operations Centre · part of the BNGSOFT NOC platform for the XDP BNG.
Screens in this document are from a live deployment; subscriber names, gateway names, operator names
and addresses have been replaced throughout.