
Your engineer has thirty seconds before the phone rings.
Where does he look?
NOC2 watches every gateway, every access node and every subscriber session you run, and ranks what is wrong by how many customers it affects. This handbook is the working half of that: the three procedures an operator actually needs, the real detection window behind each one, and a reference card for the rest.
Most of what goes wrong on a subscriber network never shows up as down. A gateway that drops its customers for thirty minutes at three in the morning and recovers. A session that authenticates, takes an address, and then carries nothing for six hours. A gateway that loses a fifth of its subscribers over three weeks without one bad day. Every one of those is invisible to up/down monitoring, and every one of them is somebody's Monday morning.
Before you start: four drawers
The menu is grouped by what you are doing, not by what the data is. Once that lands, people stop hunting.
What is happening now. Dashboard, Live Console, Network Map, SLA.
Open it when you arrive.
Something needs doing. Alerts, Incidents, Customer Impact, Maintenance, On-Call.
Open it when the dashboard says so.
The things themselves. Servers, Subscribers, Subscriber Experience, Subscriber Base.
Open it when you know which box.
Why, and what it costs. Session Analytics, Capacity, Business Overview.
Open it on a quiet afternoon.
The habit worth building. Always start at the Dashboard, even when you are sure you already know what is wrong. It ranks by how many subscribers are hurting, and that is routinely a different order from the one in your head — the gateway that has been dark for eighteen days may matter far less than the one that started wobbling an hour ago.
How quickly NOC2 knows
Not every fault announces itself at the same speed, so NOC2 does not pretend to a single number. These are the intervals the system actually runs at, not service targets.
The long windows are not slowness. A gateway shedding a fifth of its customers over three weeks cannot be seen in five minutes, because no single day of it looks unusual. Measuring it over the right window is what makes it visible at all.
Procedure 1 · A gateway is down, or behaving badly
-
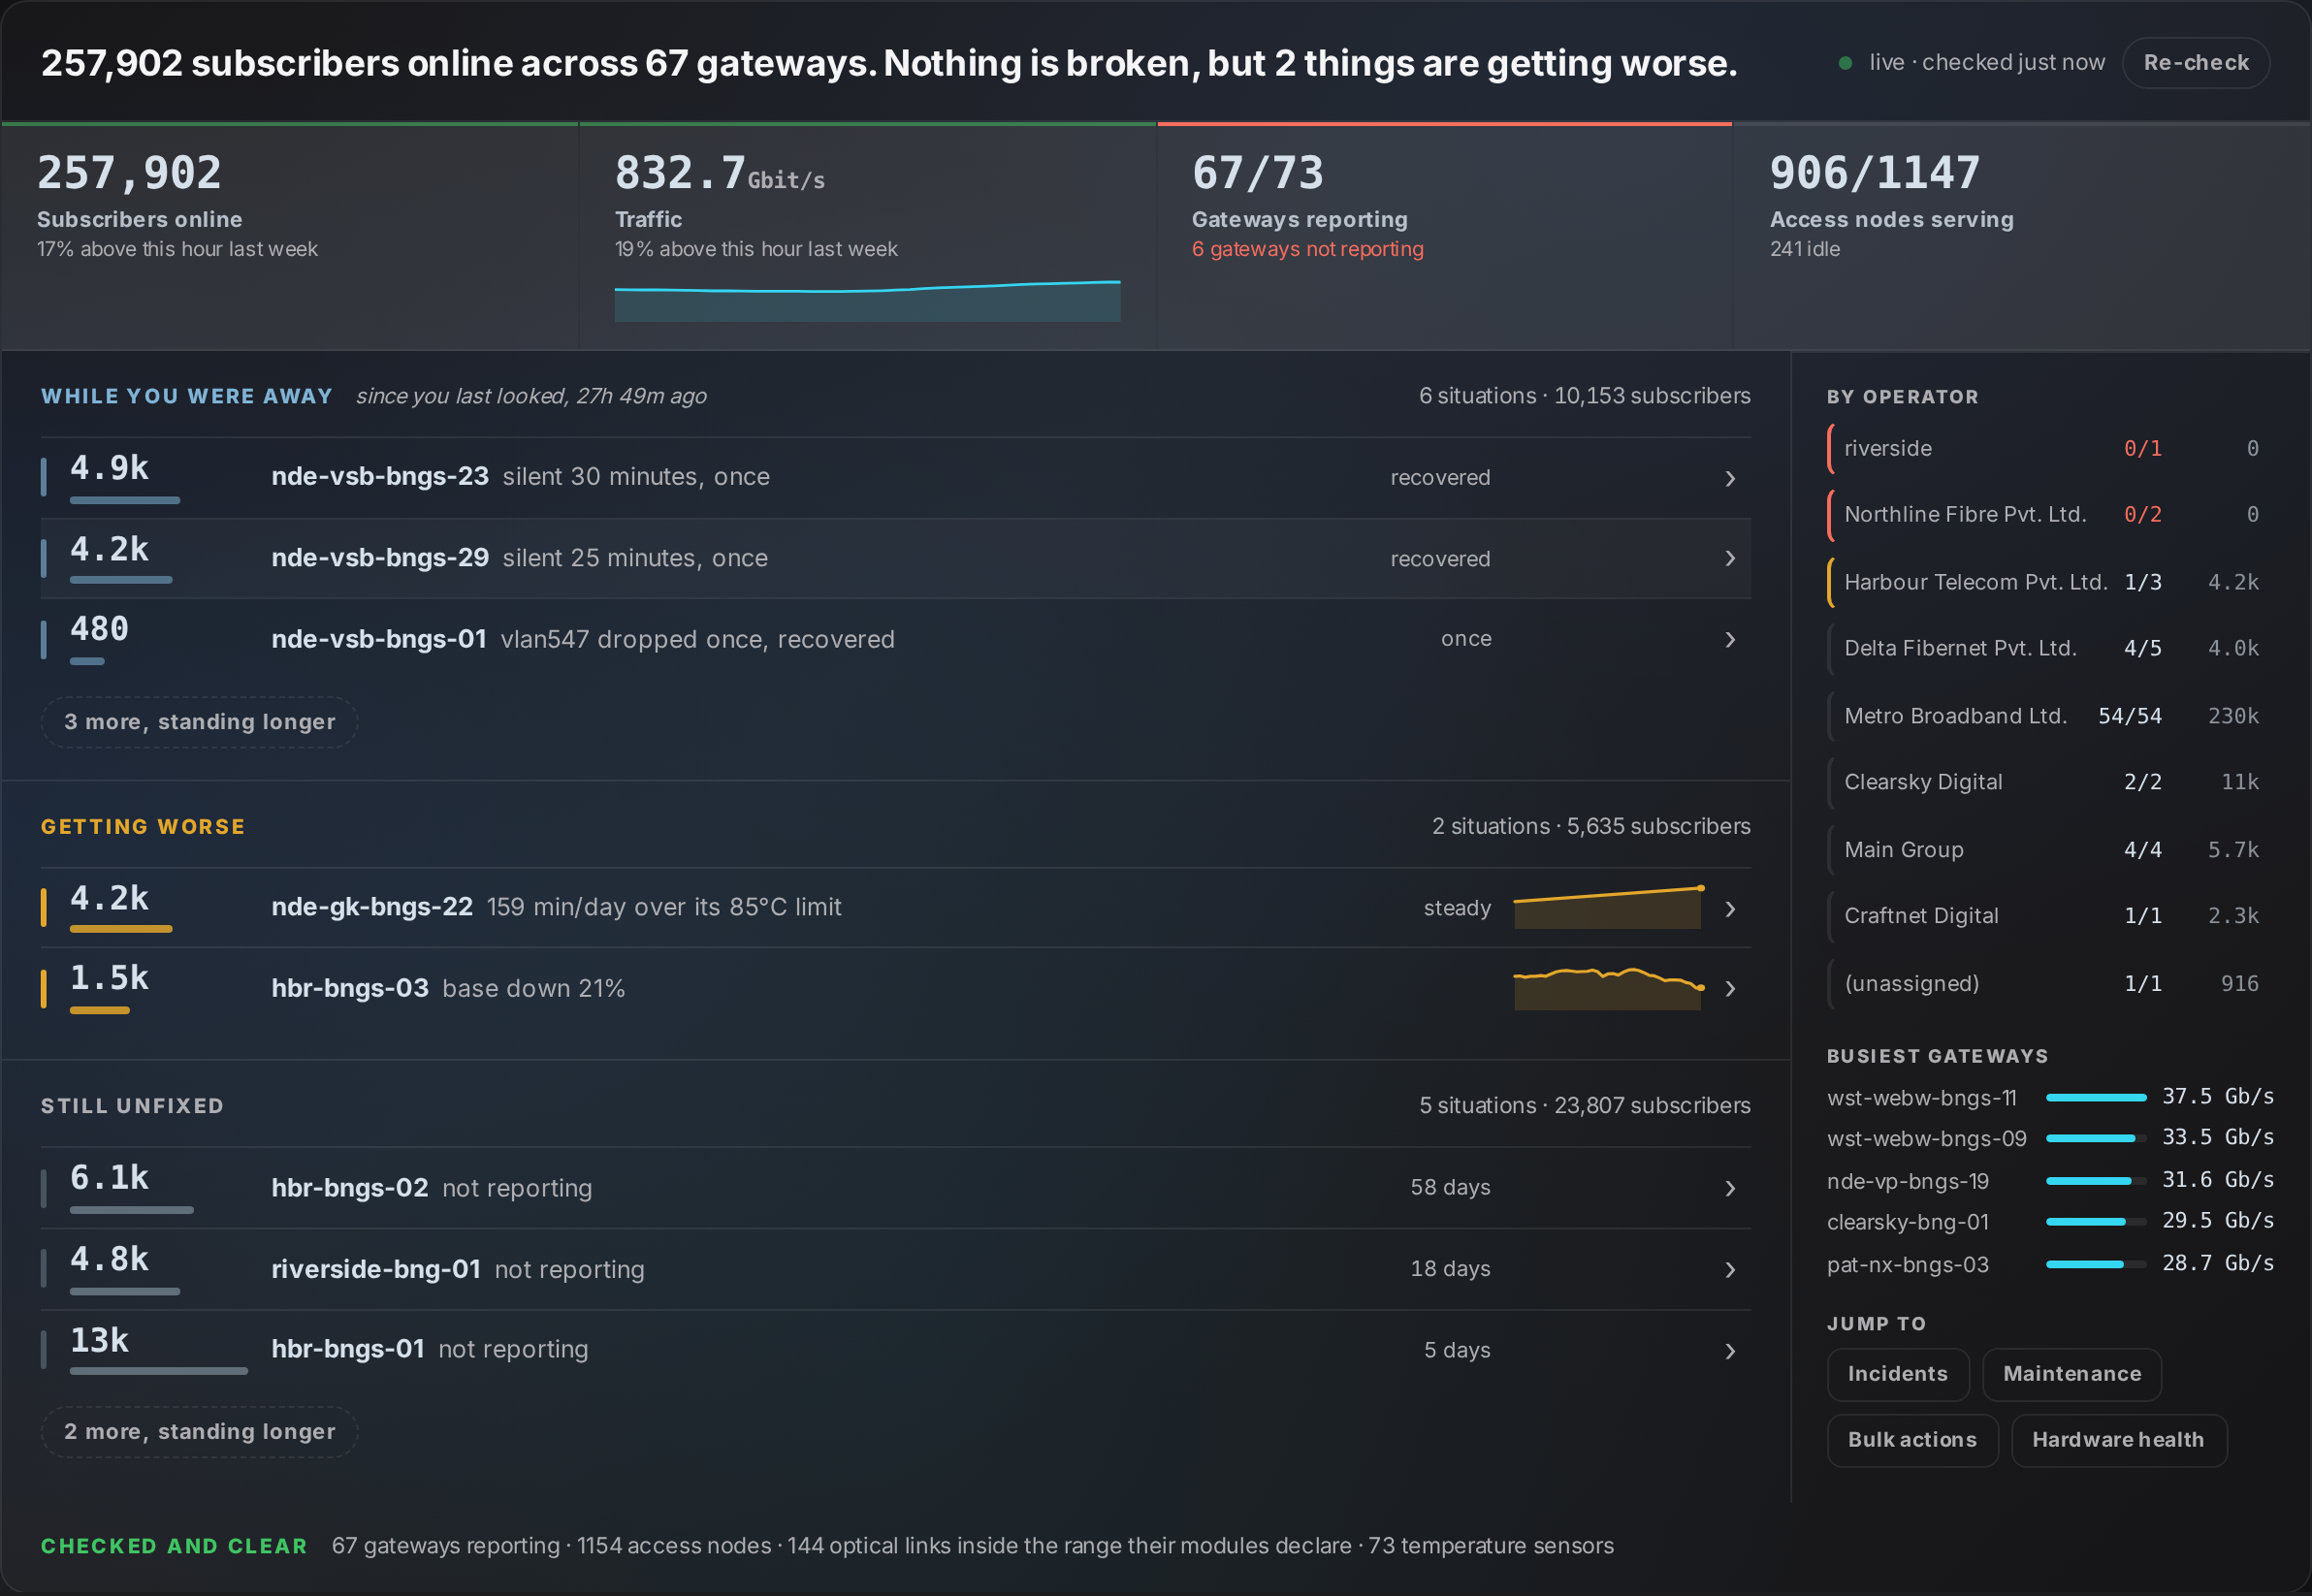
Read the sentence at the top
How many subscribers are online, across how many gateways, and whether anything needs you. It is computed from the same measurements as everything below it, so if it says nothing is broken, nothing is broken.
-
Check While you were away before anything else
This is the lane that catches what recovered on its own. A gateway silent for thirty minutes overnight and back before you woke up appears in no current-status view ever built — and is very often the first sign of the failure that takes the box out for good a fortnight later.
-
Open the situation before you open the server
Each row expands into what was measured, what has been ruled out, and the suggested next step. The ruled-out line is the one worth reading: it will tell you this is not a reporting gap, not a planned migration, not the evening traffic dip — the twenty minutes of checking you would otherwise do yourself.
-
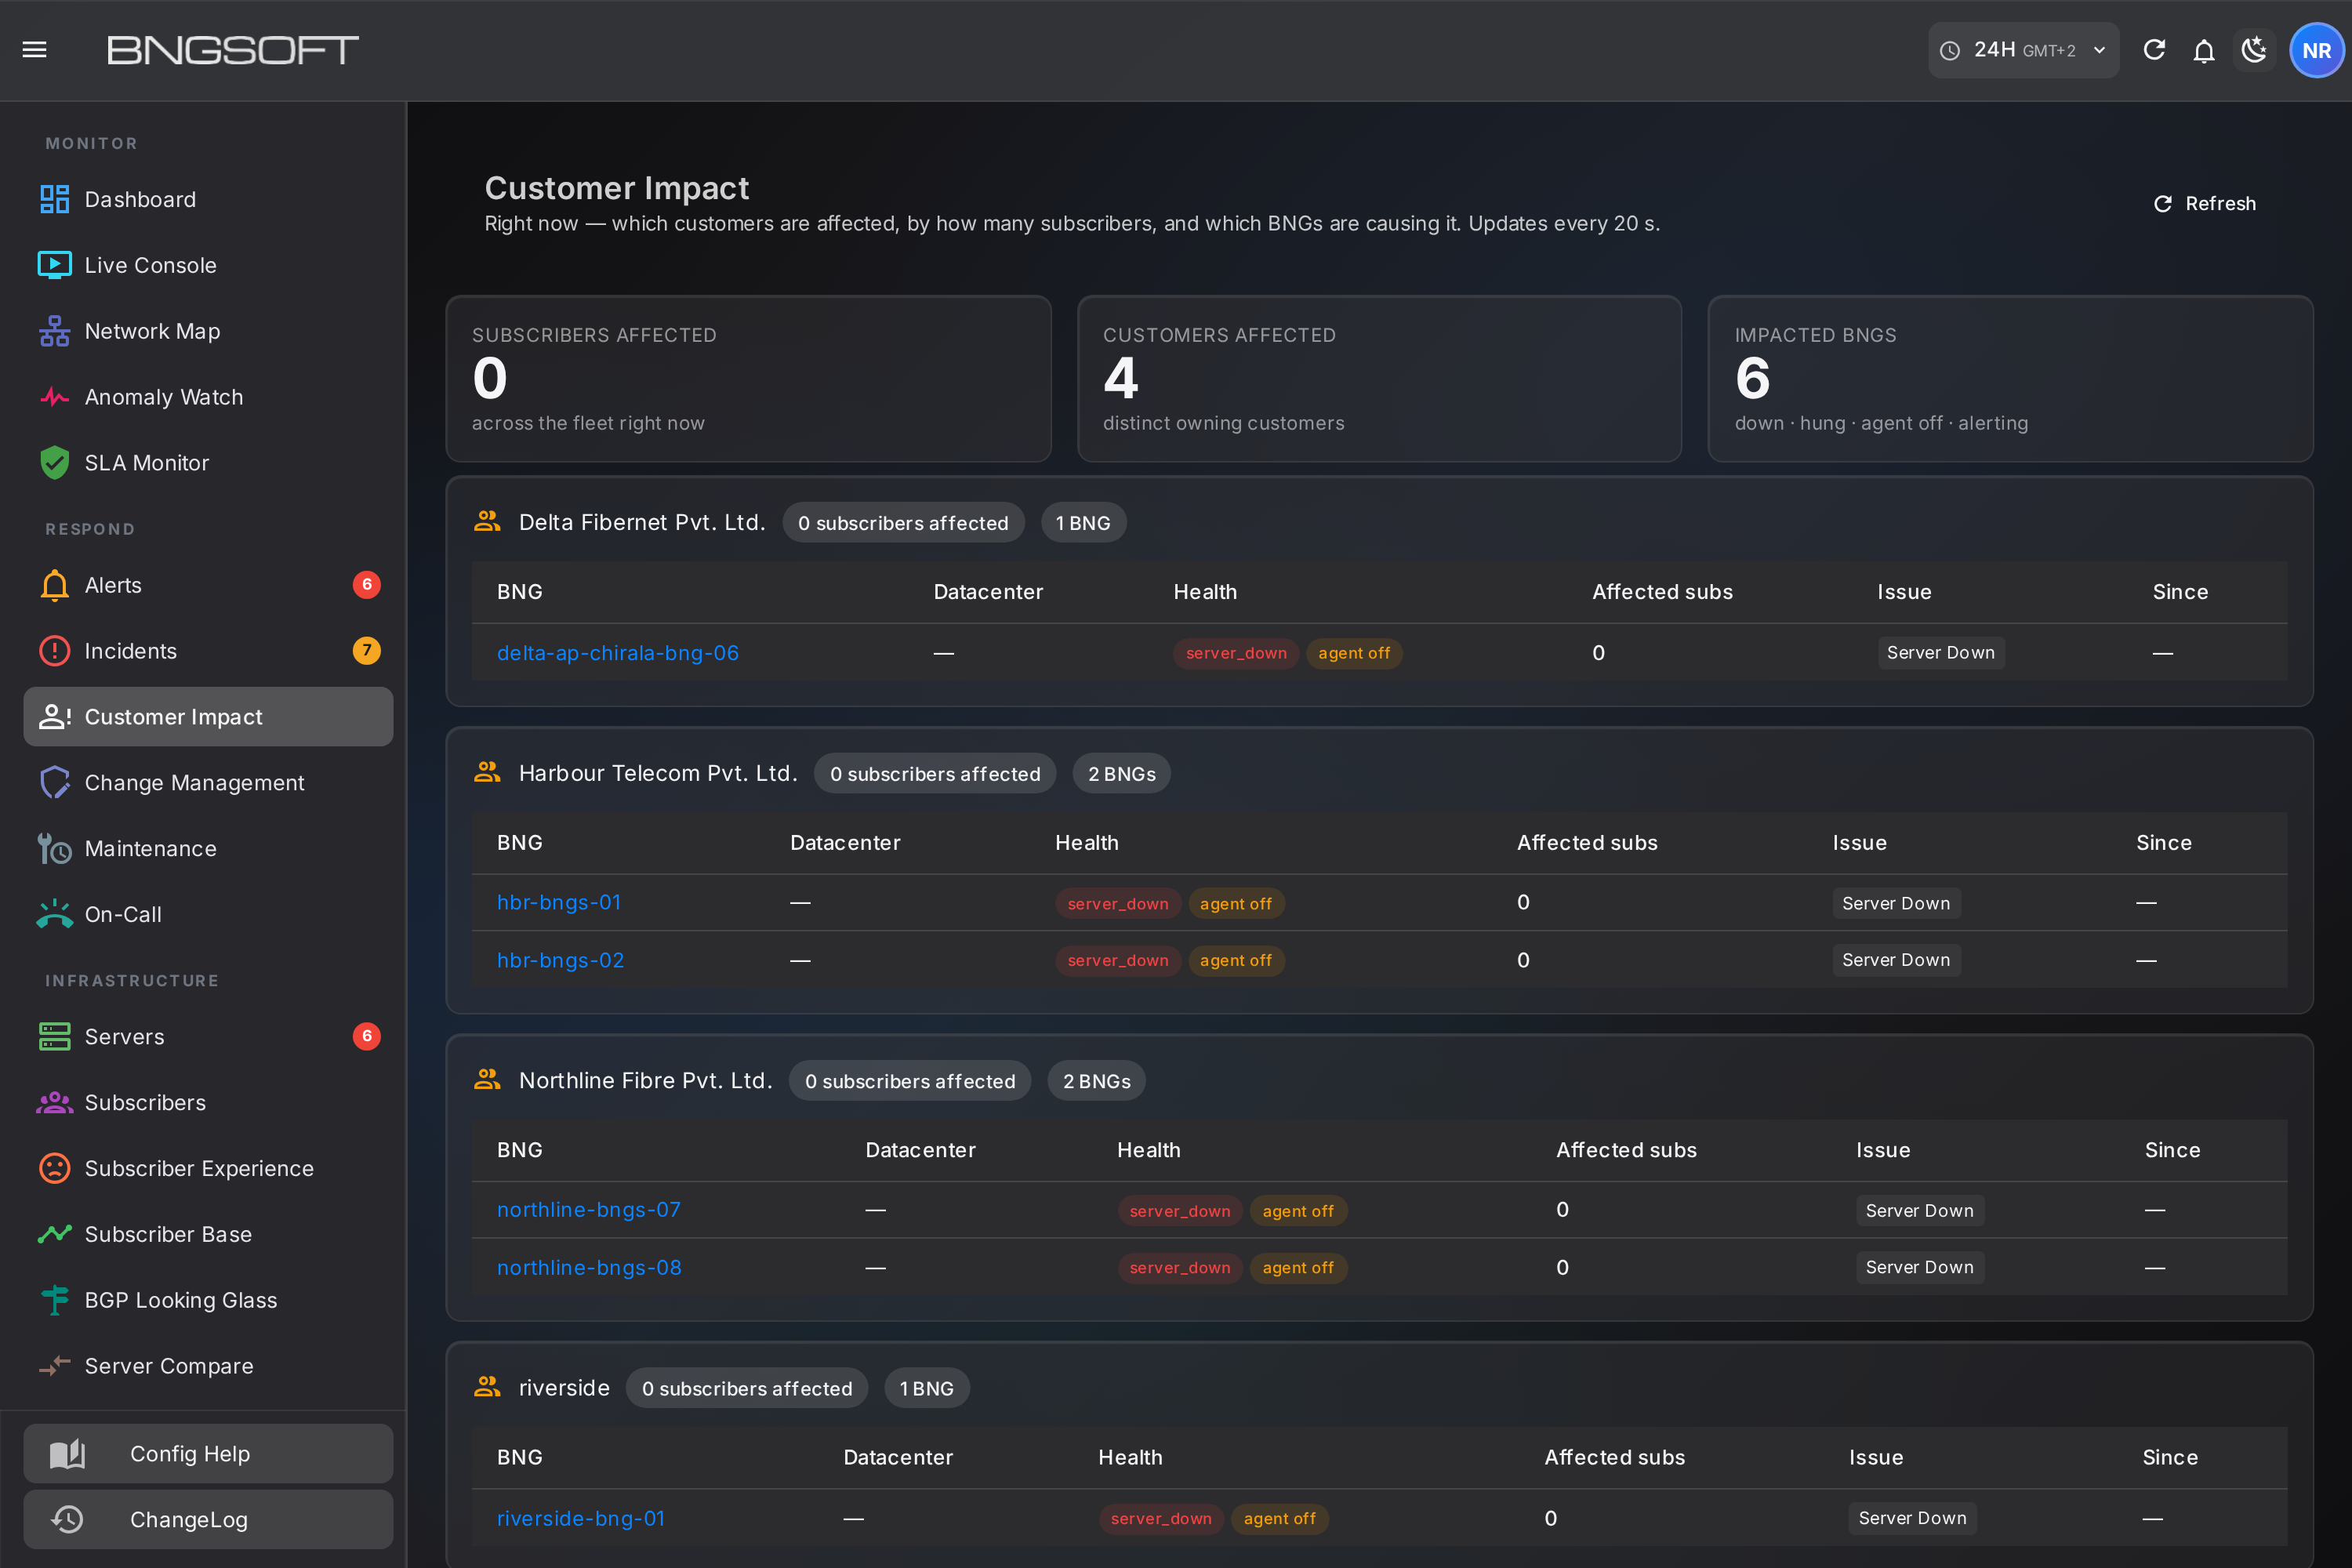
Size the blast radius in Customer Impact
Which operators are affected, by how many subscribers each, and which gateways are causing it. This is the page to have open when somebody senior asks how bad it is.
-
Then work the box
Servers for detail, history and configuration; Live Console when you need to run something on it. If the fix is a configuration change, put it through Change Management so the before-and-after is measured against the same hour yesterday rather than guessed at.
Do not acknowledge an alert to make it quiet. Acknowledging silences that alert permanently, not until tomorrow. If the thing is real but not urgent, leave it where it is — the dashboard has already ranked it below the urgent ones, which is exactly what you wanted.
Procedure 2 · A customer is on the phone
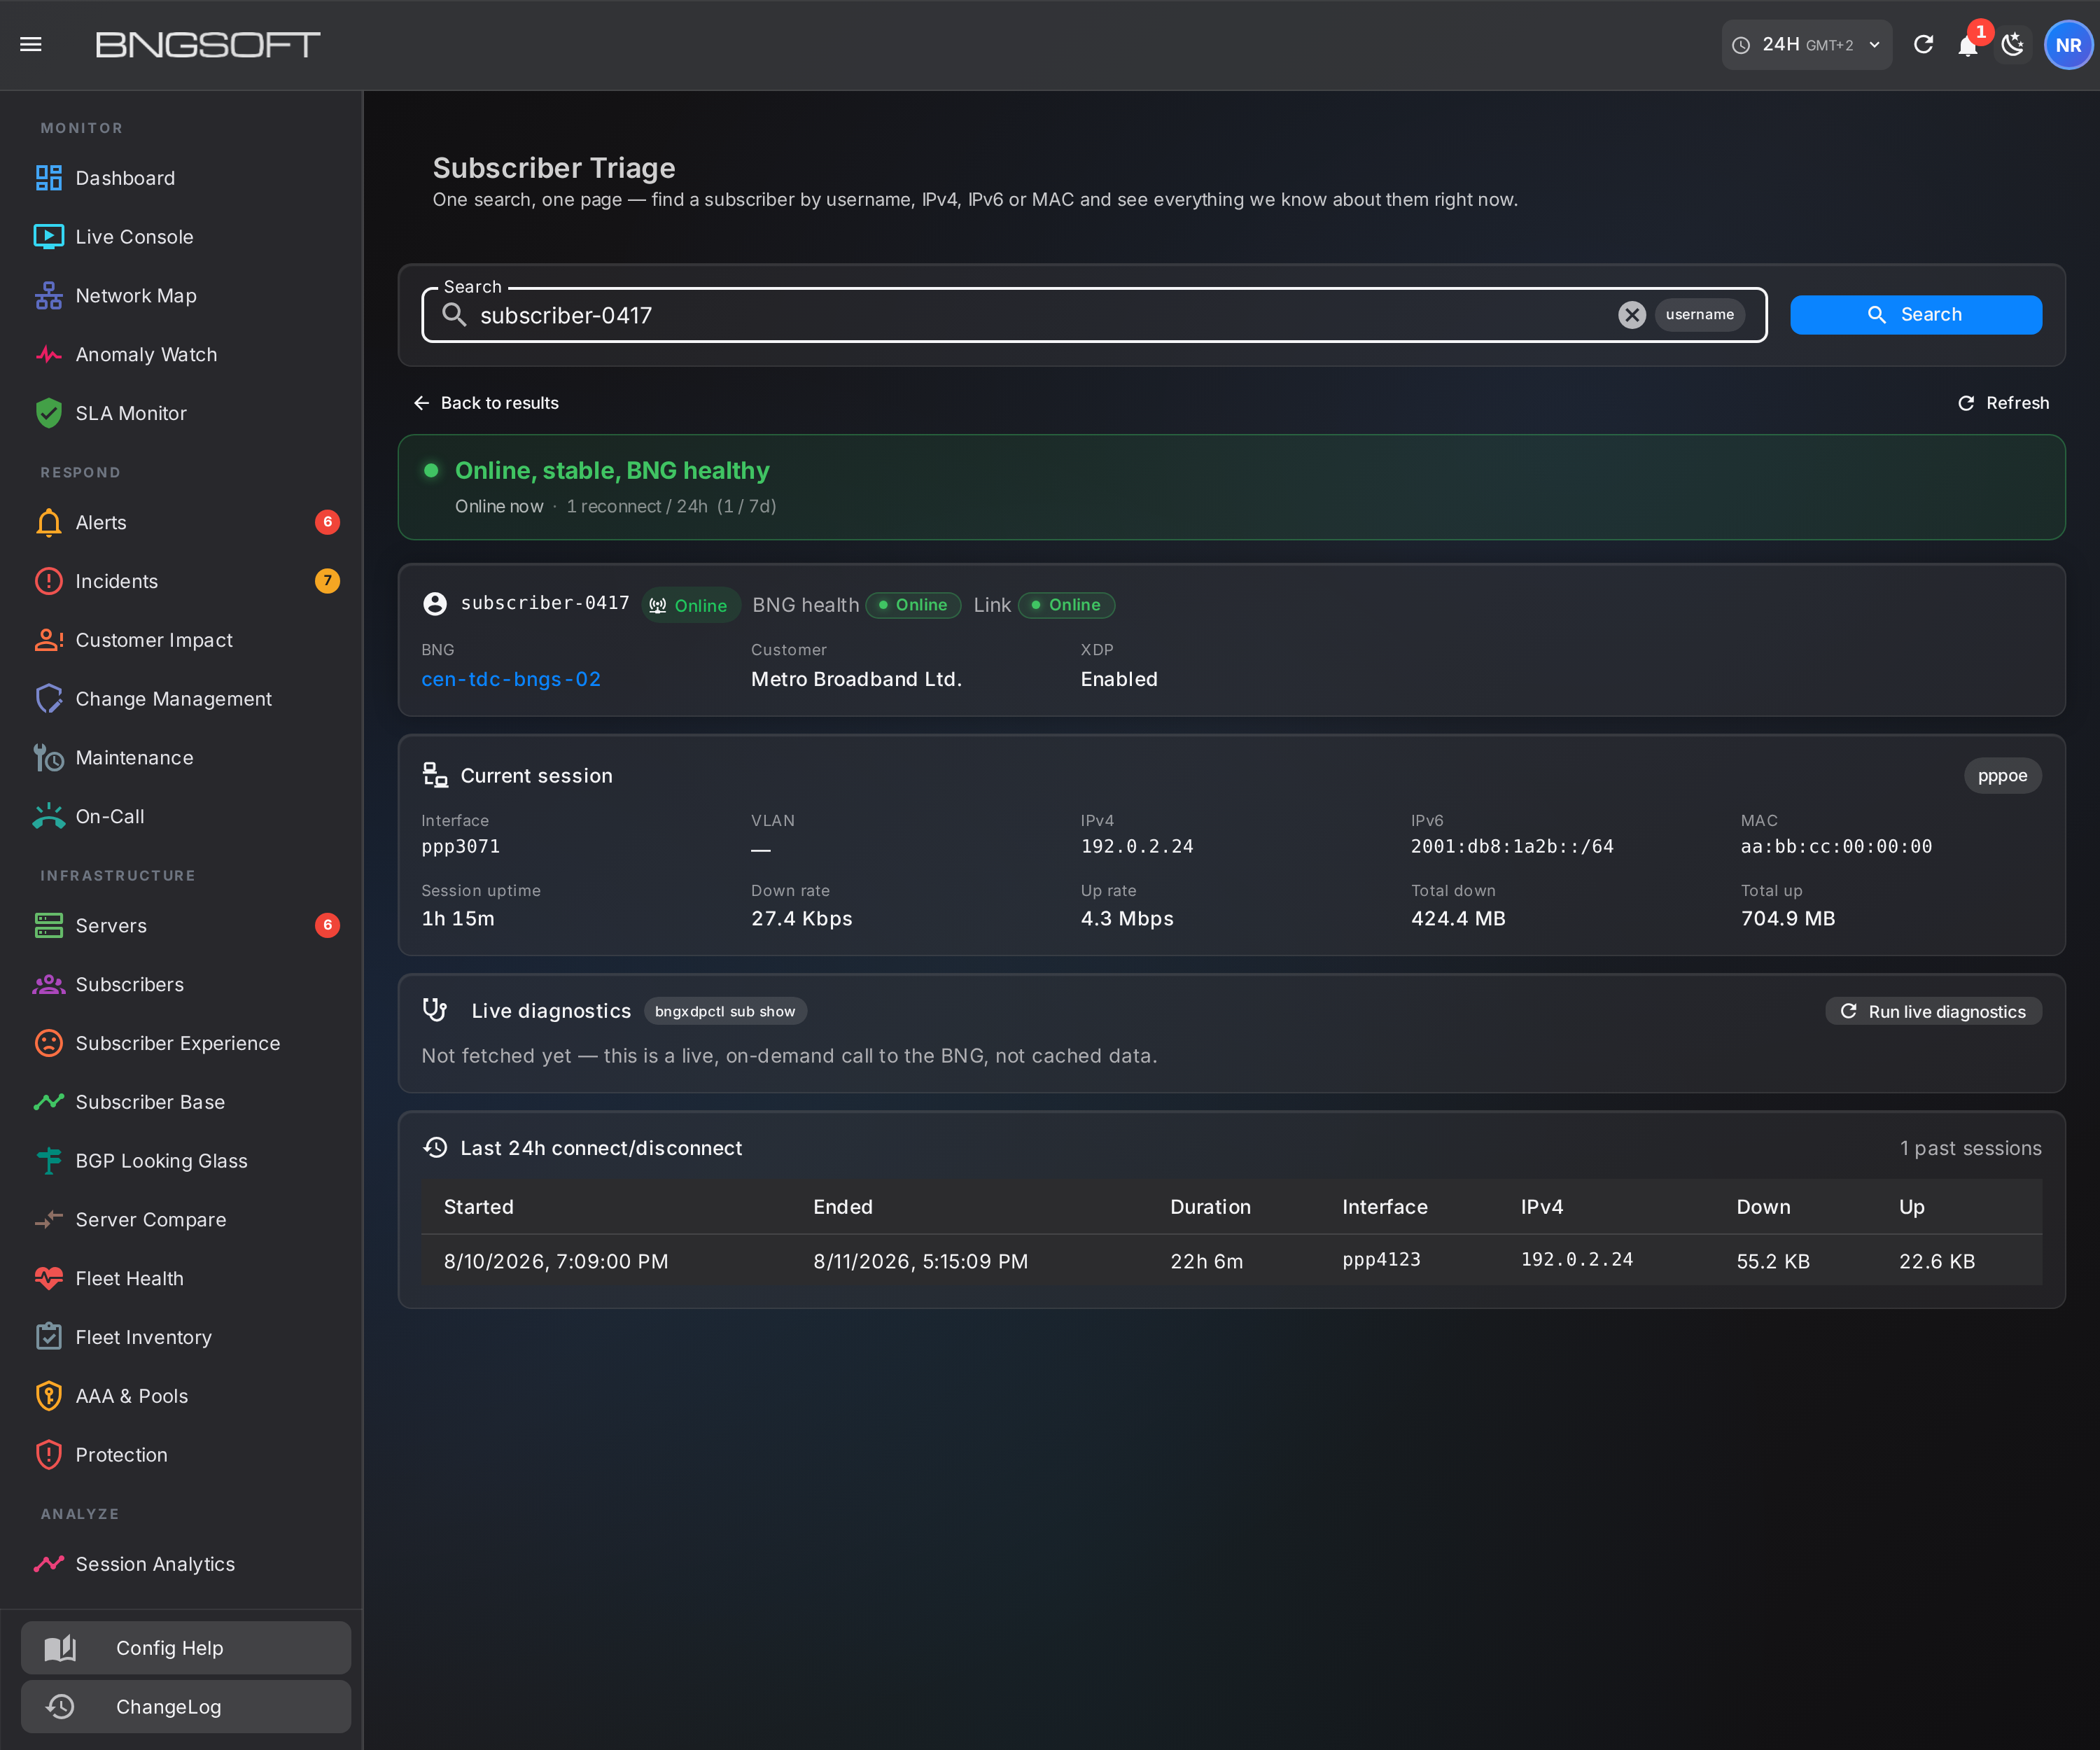
One page answers this. Tools → Subscriber Triage takes a username, an IPv4, an IPv6 or a MAC — whatever the customer or your CRM can give you — and returns everything known about them right now.
-
Search, and read the banner
Online, stable, BNG healthy means the problem is not on your side of the line, and your first-line staff can say so with confidence. The three chips beside the name separate the three things people confuse constantly: the subscriber's session, the gateway's health, and the link.
-
Check the reconnect count
Shown as n / 24h and n / 7d. One or two is normal. Twenty-five in a day is a fault, and the threshold is not a guess — across this fleet, 88% of subscribers reconnect fewer than five times a day.
-
Look at the session, not at the plan
Interface, VLAN, addresses, uptime, current rates and total bytes. A session up for hours having moved almost nothing is a broken connection that is technically online — the single most common complaint that every status page in the world reports as healthy.
-
Run live diagnostics only if you still need to
The button queries the gateway itself, on demand. It is deliberately not automatic: it is a live call to production equipment, and everything above it already came from data NOC2 holds.
-
Read the disconnect history
Every session start, end, duration and byte count for the last day. A customer who "keeps dropping" either has a row of short sessions here — in which case believe them — or does not, in which case the fault is inside their premises.
Is it us, or is it them?
Procedure 3 · Nobody called, and something is still wrong
This is the procedure that pays for the platform. Most customers do not report faults. They tolerate them, and then they leave.
-
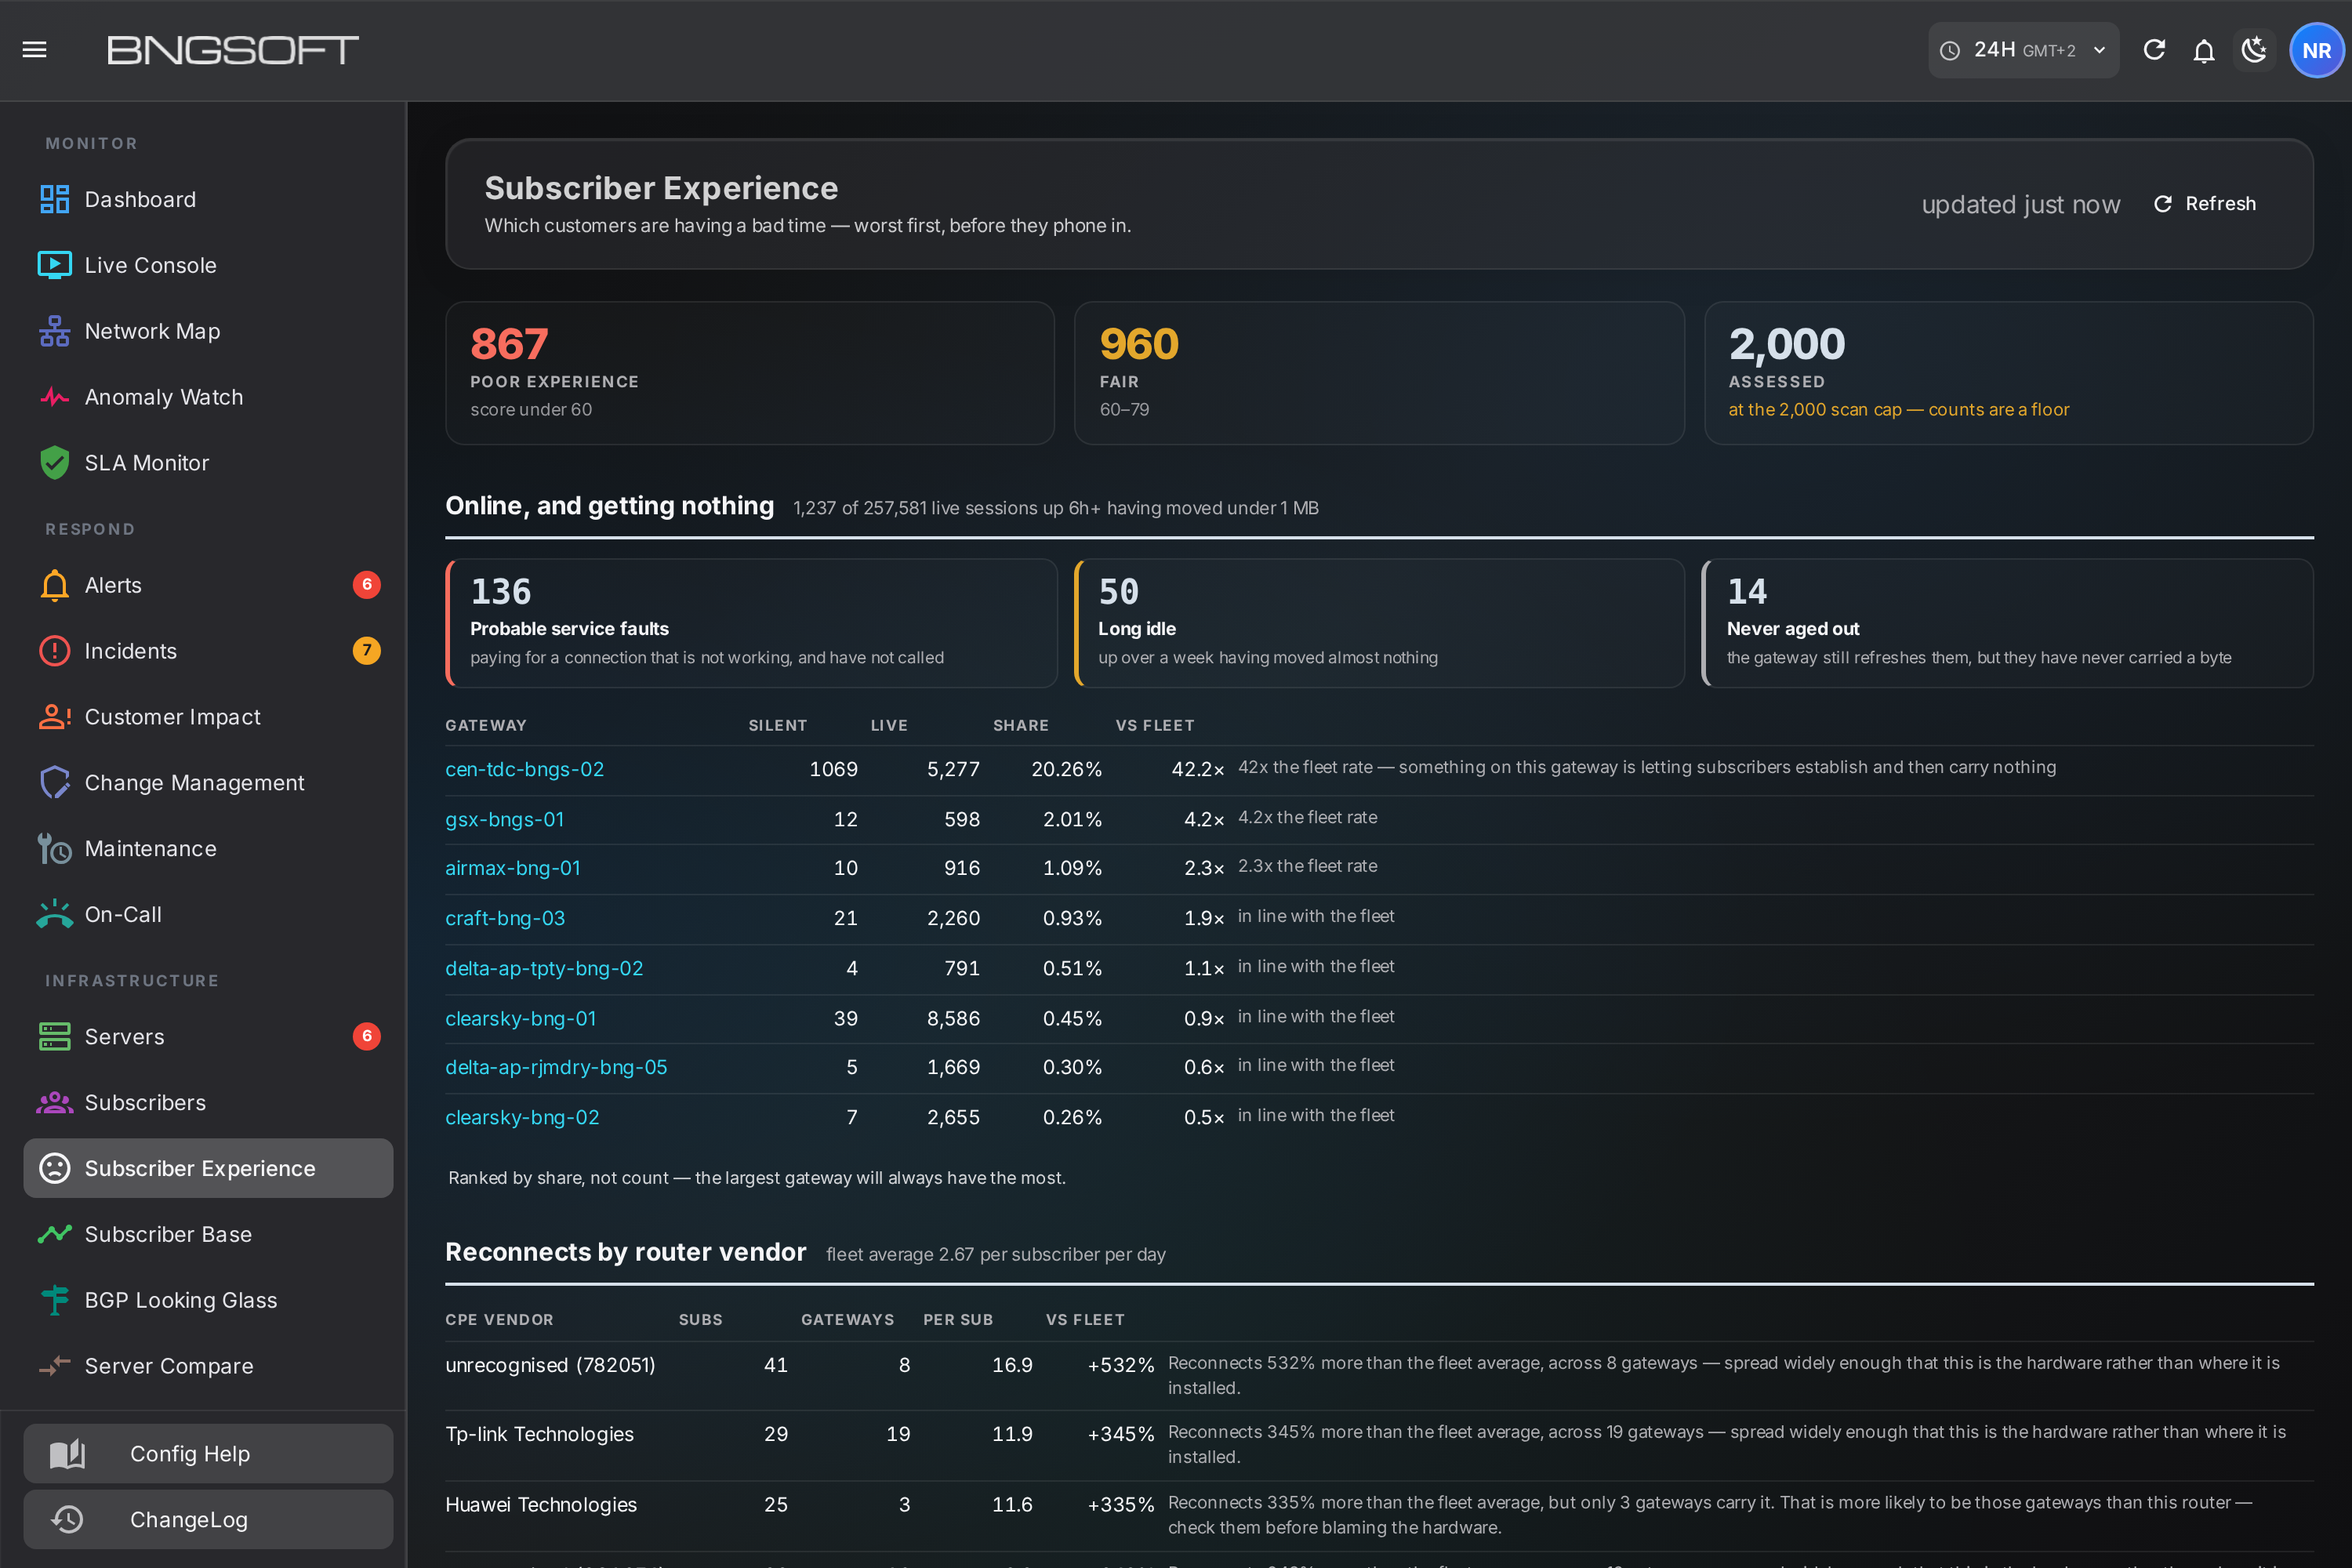
Subscriber Experience — who is having a bad time
Scored on reconnects, connected time, and how slowly authentication is running on their gateway. Throughput is deliberately not scored: a customer reading email at three in the morning is not having a bad experience, and scoring them would fill the worst-list with idle people.
On the network these screenshots came from, right now: 1,237 sessions have been up more than six hours having moved under a megabyte, and 136 of those are probable service faults — people paying for a connection that is not working, who have not called.
-
Find the gateway, not the person
The per-gateway table compares each one against the fleet rate. One gateway currently sits at 42× the fleet rate for silent sessions. That is not a thousand unlucky customers; that is one box letting subscribers establish and then carry nothing.
-
Blame the router only when the data allows it
Reconnects grouped by CPE vendor, with the caveat printed for you: a vendor spread across nineteen gateways really is the hardware, whereas one concentrated on three gateways is probably those three gateways. The page states which case you are looking at rather than leaving you to infer it.
-
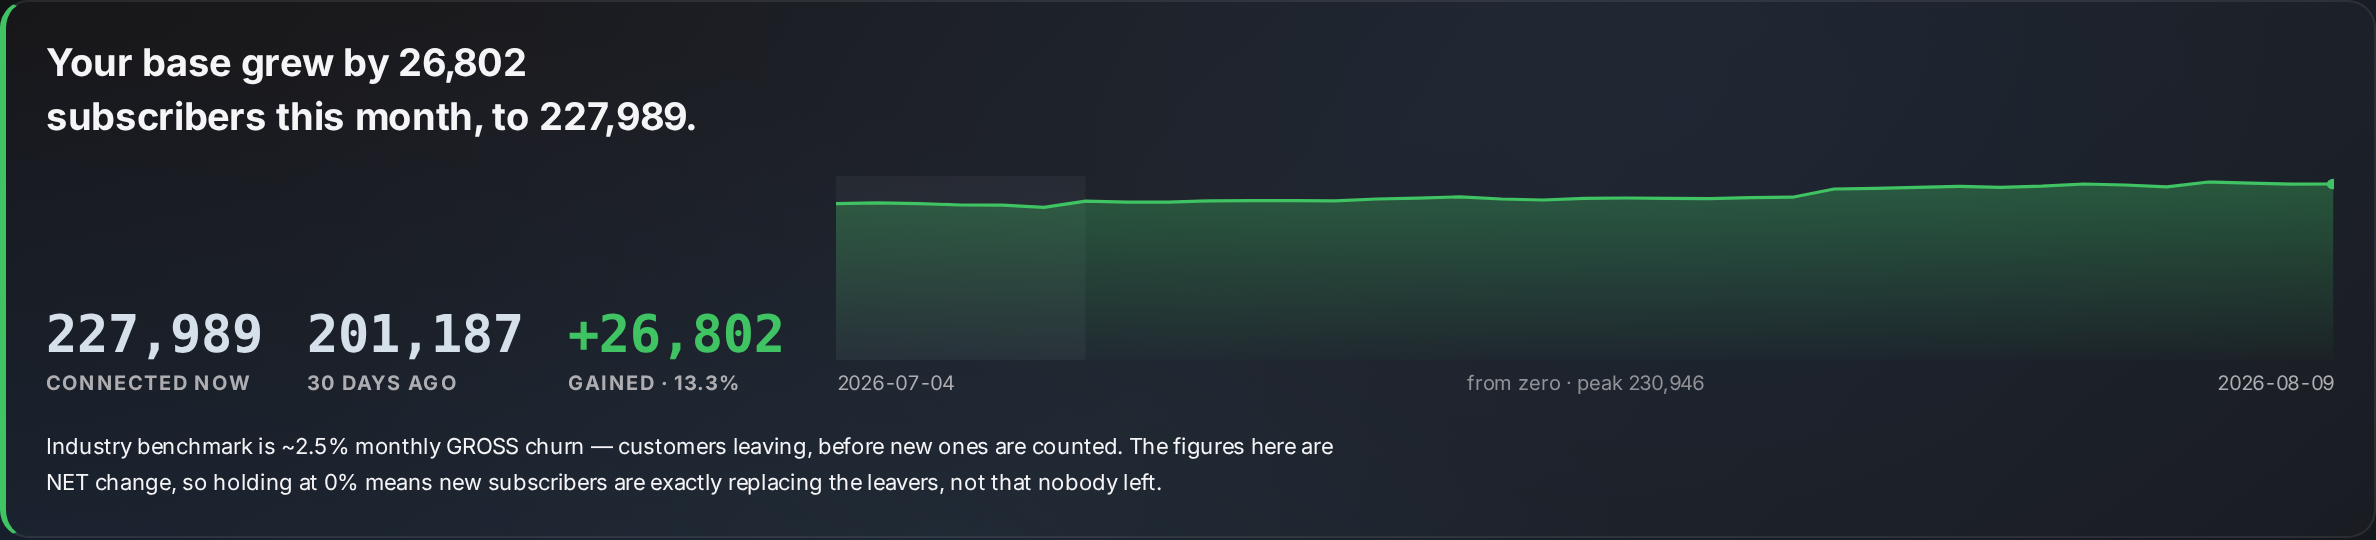
Subscriber Base — are the customers still there at all
The only view that reports something every other signal calls healthy. A gateway can be online, cool, error-free and correctly configured while its customer base quietly halves.
Why finding it early is the whole product
A real case from a production network. One gateway lost a fifth of its subscriber base over three weeks. It never went down, never overheated, never dropped a link, and never tripped a single conventional alert. The day numbers below are the measured ones; the spacing is even for legibility, so read the labels rather than the gaps.
Conventional monitoring
NOC2
of warning, on a class of fault that up/down monitoring cannot see at all — because nothing was ever down. The same principle runs through the rest of the platform: the two gateways that went silent for twenty-five and thirty minutes overnight and recovered by themselves are on today's dashboard, and would appear on no status page anywhere.
Without it
The fault is found when enough customers complain, which selects for the loudest rather than the worst.
An engineer spends the first twenty minutes establishing whether it is a real outage, a drained box, or a gateway nobody ever connected.
Silent degradation is never found at all. It shows up months later as churn nobody can explain.
With NOC2
The fault is ranked by how many subscribers it affects, before the first call arrives.
The alternatives have already been ruled out in writing, so the first twenty minutes go on the fix.
Silent degradation has its own detector, its own window, and a named list of the customers it touched.
An honest note, because you may show this to a customer. Every figure above is a detection time, which NOC2 controls. How quickly a fault is repaired depends on your engineers, your spares and your field team, and no monitoring platform should claim otherwise. What this one guarantees is that the clock starts as early as the measurements allow, and that you are told what has been ruled out as well as what has been found.
Where to go, by what just happened
| What happened | Go here | What it answers |
|---|---|---|
| I have just logged in | Dashboard | Does anything need me, and in what order |
| A gateway is down | Customer Impact | Who is affected, and by how many subscribers |
| A customer is on the phone | Tools → Subscriber Triage | Everything about that subscriber, right now |
| "It keeps disconnecting" | Subscriber Triage | Reconnect count and the full session history |
| "It's connected but nothing works" | Subscriber Experience | Sessions online and carrying nothing |
| A whole area is complaining | Dashboard → access situations | Which access node collapsed, and when |
| Something feels slower than usual | Capacity | Load against the link, judged per direction |
| A box is running hot | Hardware Health | Each part against the limit it declares itself |
| We changed something last night | Change Management | Measured before-and-after, same hour yesterday |
| Revenue looks wrong | Subscriber Base | Whether the customers are still connecting |
| Month-end reporting | Operator Statement | Availability and volumes, per operator |
Handing it out
First-line support
Subscriber Triage and Subscriber Experience. One search field, a verdict they can read aloud, and the evidence behind it when the customer pushes back.
The NOC
Dashboard, Customer Impact, Live Console and the wall-board. Ranked by subscribers affected, so the queue orders itself.
Management, and downstream operators
Subscriber Base, Health Score and the monthly statement. A downstream operator logs into the same platform and sees only their own estate.
About the screenshots. Every image in this document is a real screen from a production deployment. Operator
names, gateway hostnames, site names, subscriber identifiers, service names, IP addresses (v4 and v6) and MAC
addresses are replaced with placeholders before the page renders, so no customer-identifying value appears in any
image. Addresses shown use the RFC 5737 and RFC 3849 documentation ranges. All measurements, counts, percentages and
timings are unmodified.
About the timings. The intervals in "How quickly NOC2 knows" are the cadences the software runs at, taken from
the running system rather than from a service target. Detection times are what the platform controls; repair times
depend on the operator's own engineers and spares and are not claimed here.