
The useful answer is not
whether. It is where.
A support desk does not need to be told a subscriber has a problem — the subscriber just told them. It needs to know which segment to send the ticket to: the customer's own line, the operator's uplink, something upstream, or nothing in the network at all.
Every per-subscriber quality detector in this industry reads the subscriber's traffic. Encryption took most of that traffic away. So we stopped reading it — and started reading the heartbeat their own router already sends us.
Why the old approach ran out of road
Loss and jitter used to be measured from the subscriber's own packets: count the retransmissions, watch the sequence numbers. That works while the traffic is TCP and readable in the middle.
QUIC is now roughly two thirds of download traffic and its packet numbers are encrypted, so there is nothing to count. On the gateway used for the measurements in this document, the traffic-reading stack had usable data for zero subscribers. Not few. Zero.
The keepalive was always there. Every PPPoE router sends the gateway a small "still here?" message on its own schedule, and has done for decades. Nobody was measuring it, because while the traffic was readable there was no need to. It is the one signal a subscriber cannot encrypt, because it is addressed to us.
Three segments, measured separately
A ticket is only actionable once the fault has a location. The gateway measures three, and they answer different questions with different owners.
The verdict, and who it belongs to
Combining the legs produces one of seven answers. The value of the list is that every entry routes the ticket somewhere different.
| Verdict | What it means | Who acts |
|---|---|---|
| access | The customer's line, their router, or something in the home | Field technician |
| shared segment | OLT, backhaul or aggregation — several customers, one cause | NOC, high priority |
| transit | Our upstream is degraded; every subscriber on the box is affected | NOC — do not dispatch |
| clean | Both legs measured and good — the network is not the problem | Close the ticket |
| access only, ok | The line is fine; transit could not be measured | Partial answer |
| access only, bad | The line is degraded; transit could not be measured | Field technician |
| unknown | Neither leg could be measured | Do not guess |
The last three matter more than they look. A monitoring system that only knows "fault" and "no fault" has nowhere to put a subscriber it could not measure, so it files them under healthy. Two of these seven verdicts exist purely to stop that happening, and every verdict carries flags saying which legs were actually measured. A partial answer is shown as partial rather than dressed up as a confident one.
What an operator actually looks at
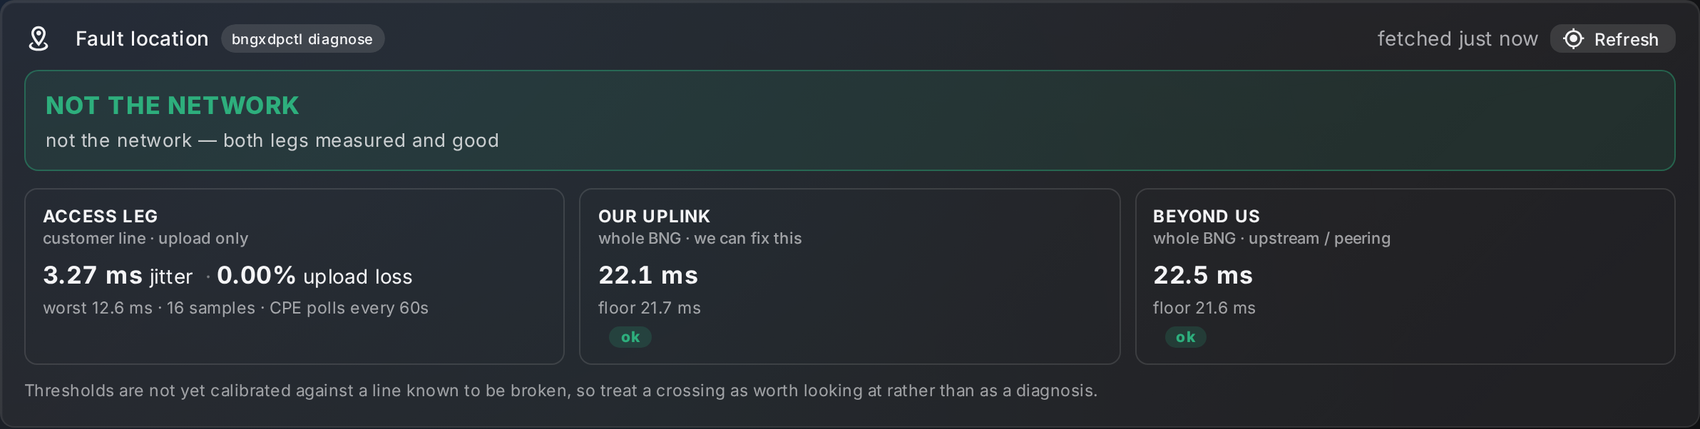
How to read it in ten seconds
The coloured line
Green means the network is measured and good. Red means a segment is at fault and the wording names which. Grey means something could not be measured — which is not the same as fine, and is never shown as a tick.
Compare against the floor
Transit legs are judged against their own best-observed value, not a universal threshold. A 22 ms path with a 21.6 ms floor is healthy; the same 22 ms on a network whose floor is 4 ms is not.
One customer or all of them
The access card is about this subscriber. The two transit cards are about the whole gateway. If several tickets in a row show the same transit degradation, it was never several tickets.
What it looks like on a real network
Measured on one gateway carrying roughly 1,600 subscribers:
| Measurement | Result | What it tells you |
|---|---|---|
| Sessions carrying the signal | 94% | Nearly every router sends keepalives; the few that do not are shown as not measured |
| Access jitter, typical | 2.8 ms median | The normal state of a healthy line, and the baseline everything else is read against |
| Access jitter, worst tenth | 40.9 ms | Where the interesting lines live |
| Lines showing upload loss | 0.49% — 5 in 1,013 | A short, workable list rather than an alert storm |
| Uplink floor / beyond floor | 21.66 ms / 21.58 ms | The gateway's own normal, learned rather than assumed |
| Router polling intervals seen | 60s, 10s, 5s, 30s, 50s | Each CPE is measured on its own cadence, not an assumed one |
0.49% is the number to notice. A detector that flags half a percent of subscribers has told you something. One that flags everybody has told you nothing — and we have shipped that mistake before, an indicator that returned a failure for every subscriber on every box and hid a real fault underneath it. If a panel lights up for your whole estate, suspect the panel.
What this does not do
No round-trip time
We see the router's message arrive but never learn when it was sent, so this is upload-side variation and upload-side loss. It is not latency, and we do not present it as latency.
A few clients send none
Around 94–99% of real CPE routers send LCP echoes. Some software diallers do not. Those subscribers show as not measured, which is the honest result rather than a gap disguised as health.
Encrypted-traffic loss
QUIC packet numbers are protected by design, so per-subscriber loss inside that traffic is unobservable from the network and always will be. This measures a different thing rather than pretending to solve that one.
And one honest caveat about the thresholds. The levels at which jitter and upload loss are called degraded were derived from the shape of a healthy population, not yet from lines known to be physically broken. Treat a crossing as worth investigating, not as a diagnosis. That correlation is the next piece of work, and we would rather say so than let a number look more settled than it is.
The bottom line
Encryption quietly removed the measurement most quality monitoring was built on, and the industry's answer has largely been to keep showing the old screens with less behind them. The alternative is not a cleverer way to read traffic nobody can read. It is to measure something else — something the subscriber's own equipment has been sending all along.
The result is that a support desk stops asking whether there is a problem and starts being told which segment owns it: dispatch, escalate upstream, or close the ticket with evidence.
About the figures and the screen. All measurements come from a production gateway carrying live subscriber traffic, not a test bench. The panel shown is the real console; it contains no operator, site, gateway or subscriber identifier of any kind.