
“How many subscribers fit on this box?”
We measured 68 of them. The usual answer is a guess.
Every BNG datasheet in the industry answers this with a single number. We went and correlated subscriber count, packet rate and CPU consumption across 68 production gateways carrying 288,676 real subscribers at eight independent operators. Subscriber count predicts your traffic almost perfectly. It predicts your CPU not at all.
It is the first question every operator asks, and the honest answer is that the number on the datasheet cannot know. Not because the vendor is lying — because subscriber count is the wrong axis, and the fleet data says so plainly.
The measurement
For every gateway we took the live subscriber count, the forwarded packet rate summed across its physical interfaces, and the CPU actually consumed. CPU percentage on its own is meaningless across mixed hardware — 10% of an 80-core server is eight cores of work and 10% of a 24-core server is two and a half — so every figure below is converted to busy cores: the real amount of silicon doing work.
Read the top bar and the bottom two together, because that is the entire finding. Subscribers tell you what your uplinks must carry, and they tell you almost exactly. Subscribers tell you nothing whatsoever about how much CPU that will cost you — and neither does the traffic itself.
Every gateway in the study, plotted. If subscriber count drove CPU, these points would climb from bottom-left to top-right. They do not. The three gateways discussed below are circled: the busiest CPU in the fleet belongs to one of the smallest subscriber counts.
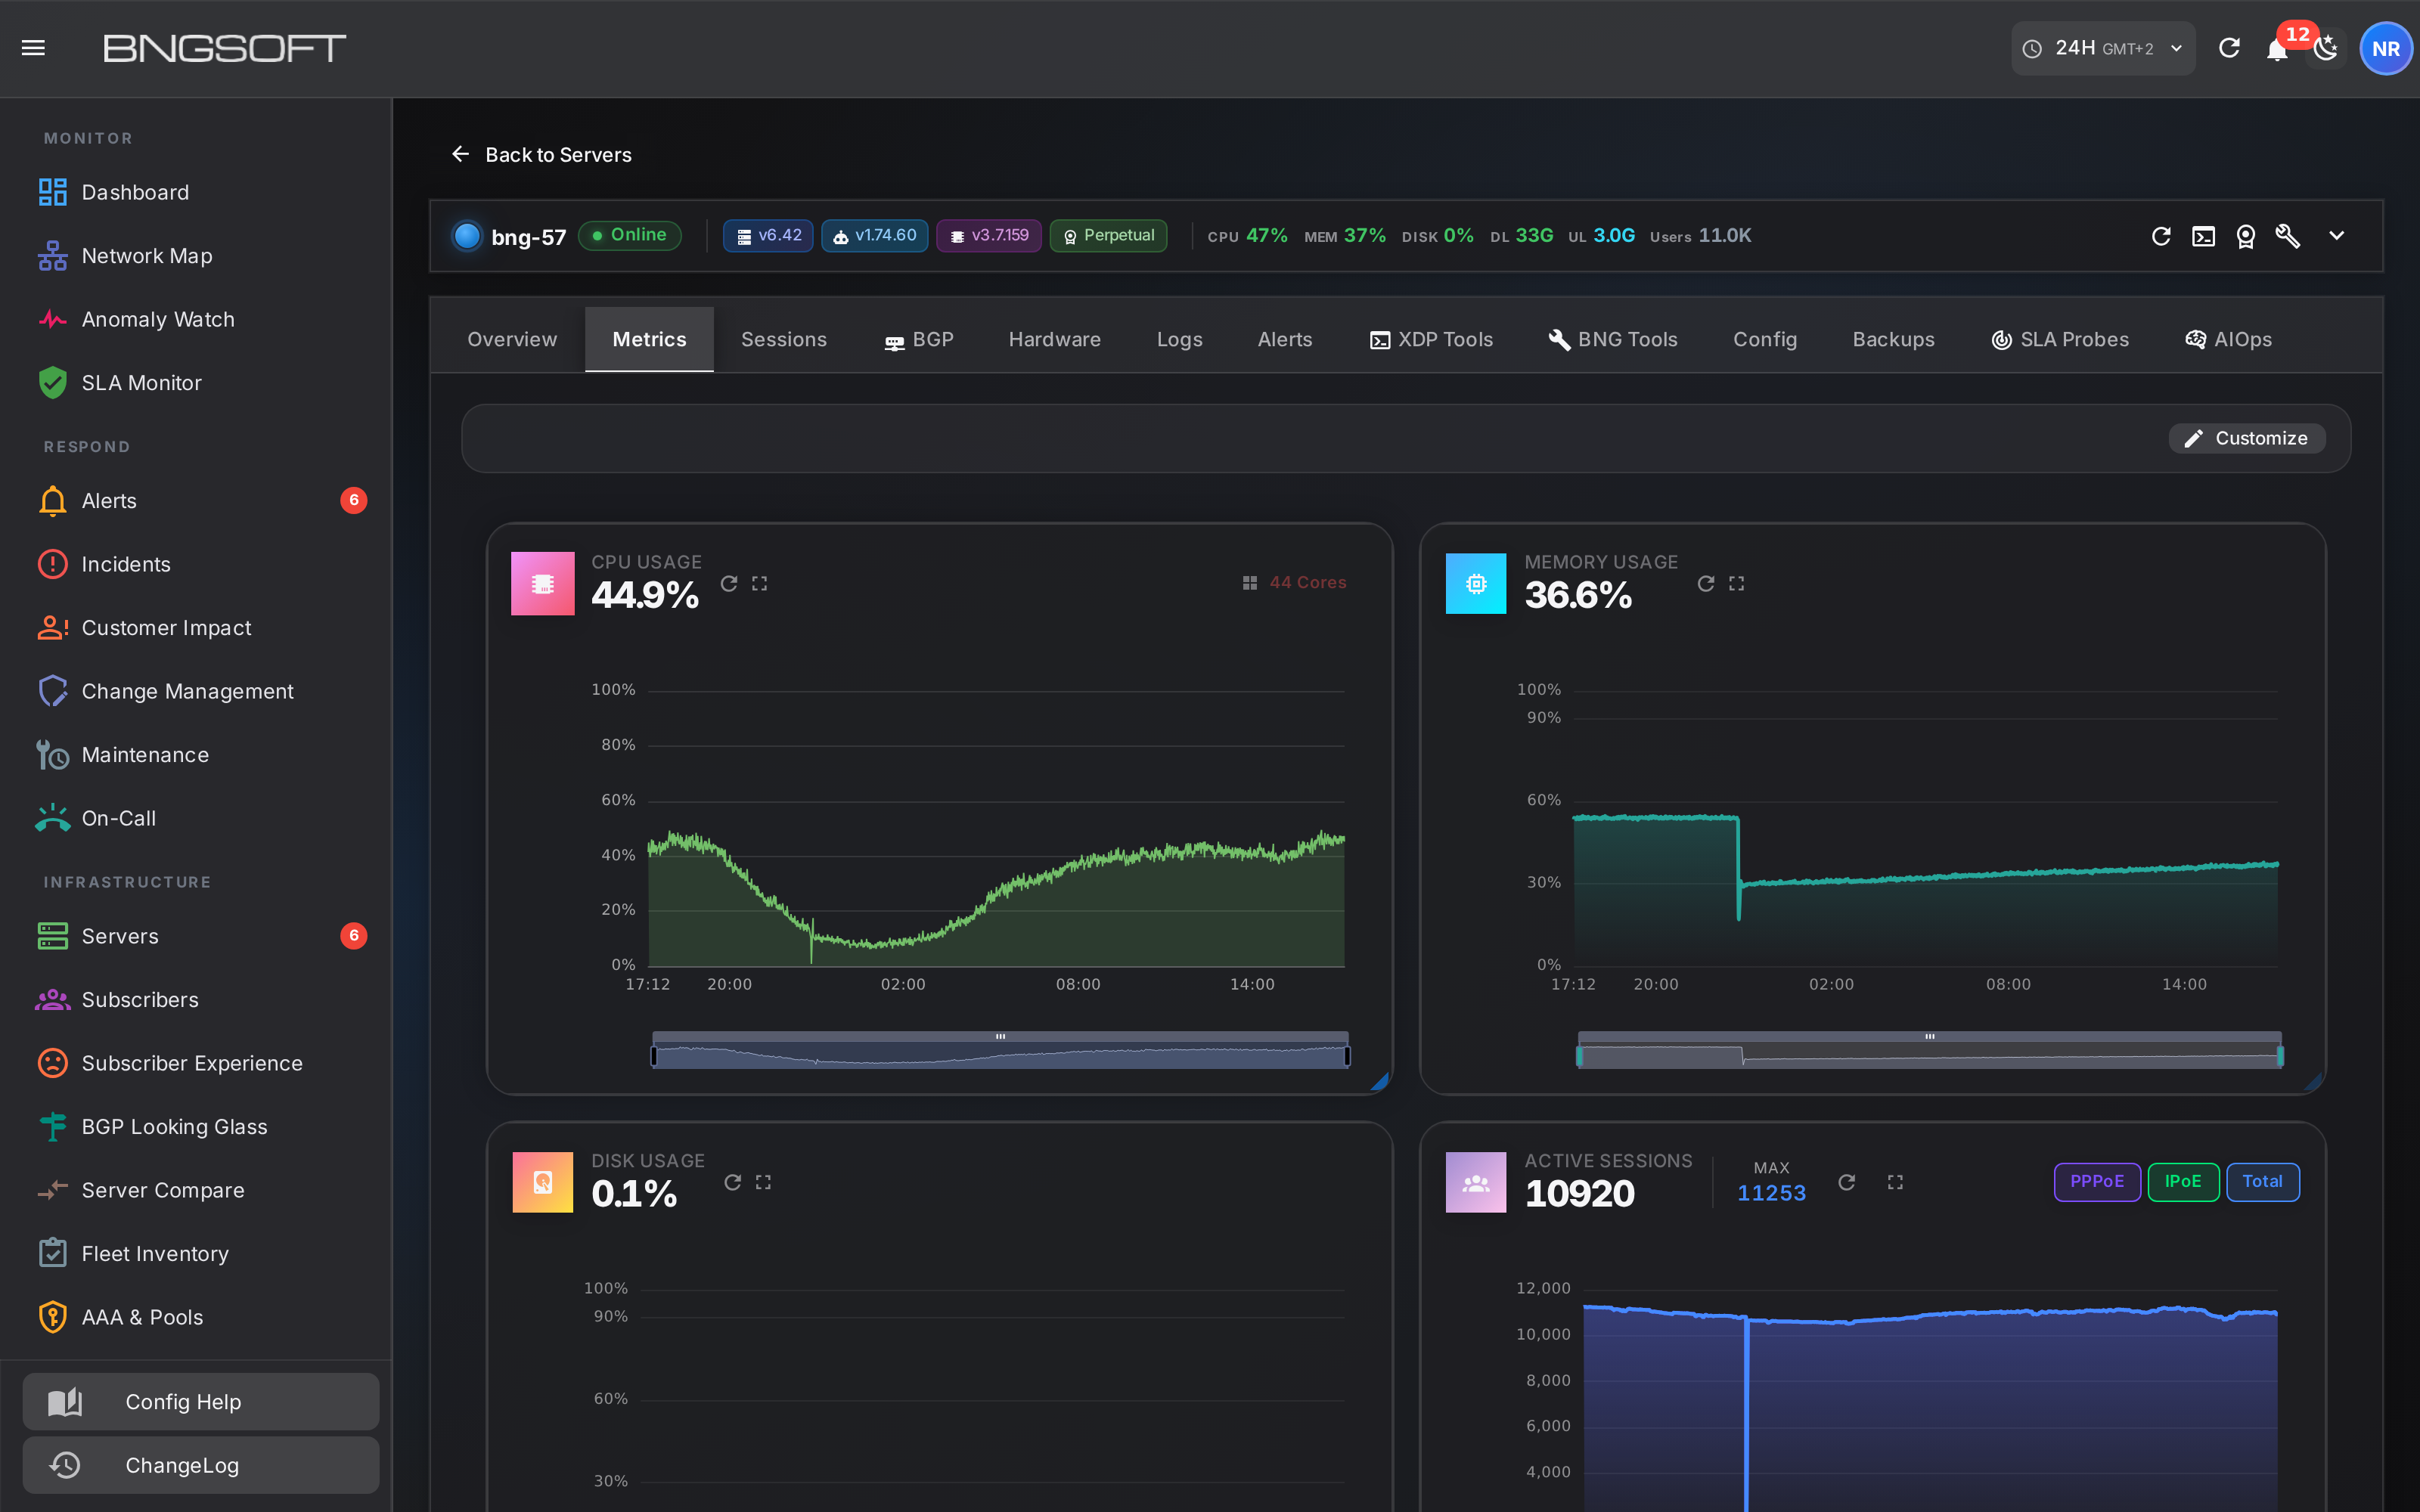
What that looks like on real hardware
Three gateways from the study. Same software, same forwarding path, all in production right now.
| Gateway | Subscribers | Forwarded | Cores installed | Cores actually busy |
|---|---|---|---|---|
| Gateway A | 8,360 | 2.29 Mpps | 56 | 1.68 |
| Gateway B | 10,336 | 2.39 Mpps | 44 | 9.46 |
| Gateway C | 2,200 | 0.54 Mpps | 32 | 17.25 |
A and B carry the same traffic. 2.29 Mpps against 2.39 Mpps — within five percent of each other. One does it on 1.68 busy cores, the other needs 9.46. That is 5.6× the silicon for the same work.
C is the case that breaks datasheet sizing outright. A quarter of Gateway A's subscribers, less than a quarter of its traffic — and ten times the CPU. Any capacity number derived from subscriber count would have put A and C on the same hardware.
So what does decide it?
Not the subscriber count, and not the packet rate. What is left is the part a datasheet has no access to: the configuration you run and the hardware you run it on. Which features are enabled and in which mode. Whether the NIC has enough queues for the cores you have. Whether interrupts land on the cores doing the forwarding. Whether session termination sits in the kernel or on the fast path. Whether a neighbouring workload shares the machine.
Your uplink
Subscriber count gives you this to within a few percent, and it holds across every operator we measured. Plan bandwidth from your subscriber base with confidence.
Your CPU
No relationship to subscribers or to traffic. It is set by configuration and hardware, which vary per deployment — so it has to be measured, not assumed.
Measure your own
The only number that means anything for your box is the one taken from your box, under your config, at your busy hour.
How we answer it instead
Because the honest answer is “it depends on your deployment”, we stopped shipping a headline capacity number and shipped the measurement instead. Every BNGSOFT gateway reports subscriber count, forwarded packets and consumed CPU continuously. The Capacity Advisor in NOC2 turns that into the answer for that gateway: how much headroom is left, at the busy hour, on the hardware and configuration actually in service.
The datasheet method
One number, derived from a lab profile that has no subscribers in it.
Assumes your feature set, your traffic mix and your NIC match the test rig.
Cannot tell you whether you are Gateway A or Gateway C — and the gap between them is 10×.
The measured method
Your gateway, your configuration, your busy hour, sampled continuously.
Headroom expressed in the units that constrain you: busy cores, packets, and link capacity.
Recomputed as your subscriber base grows, so the answer stays current instead of ageing.
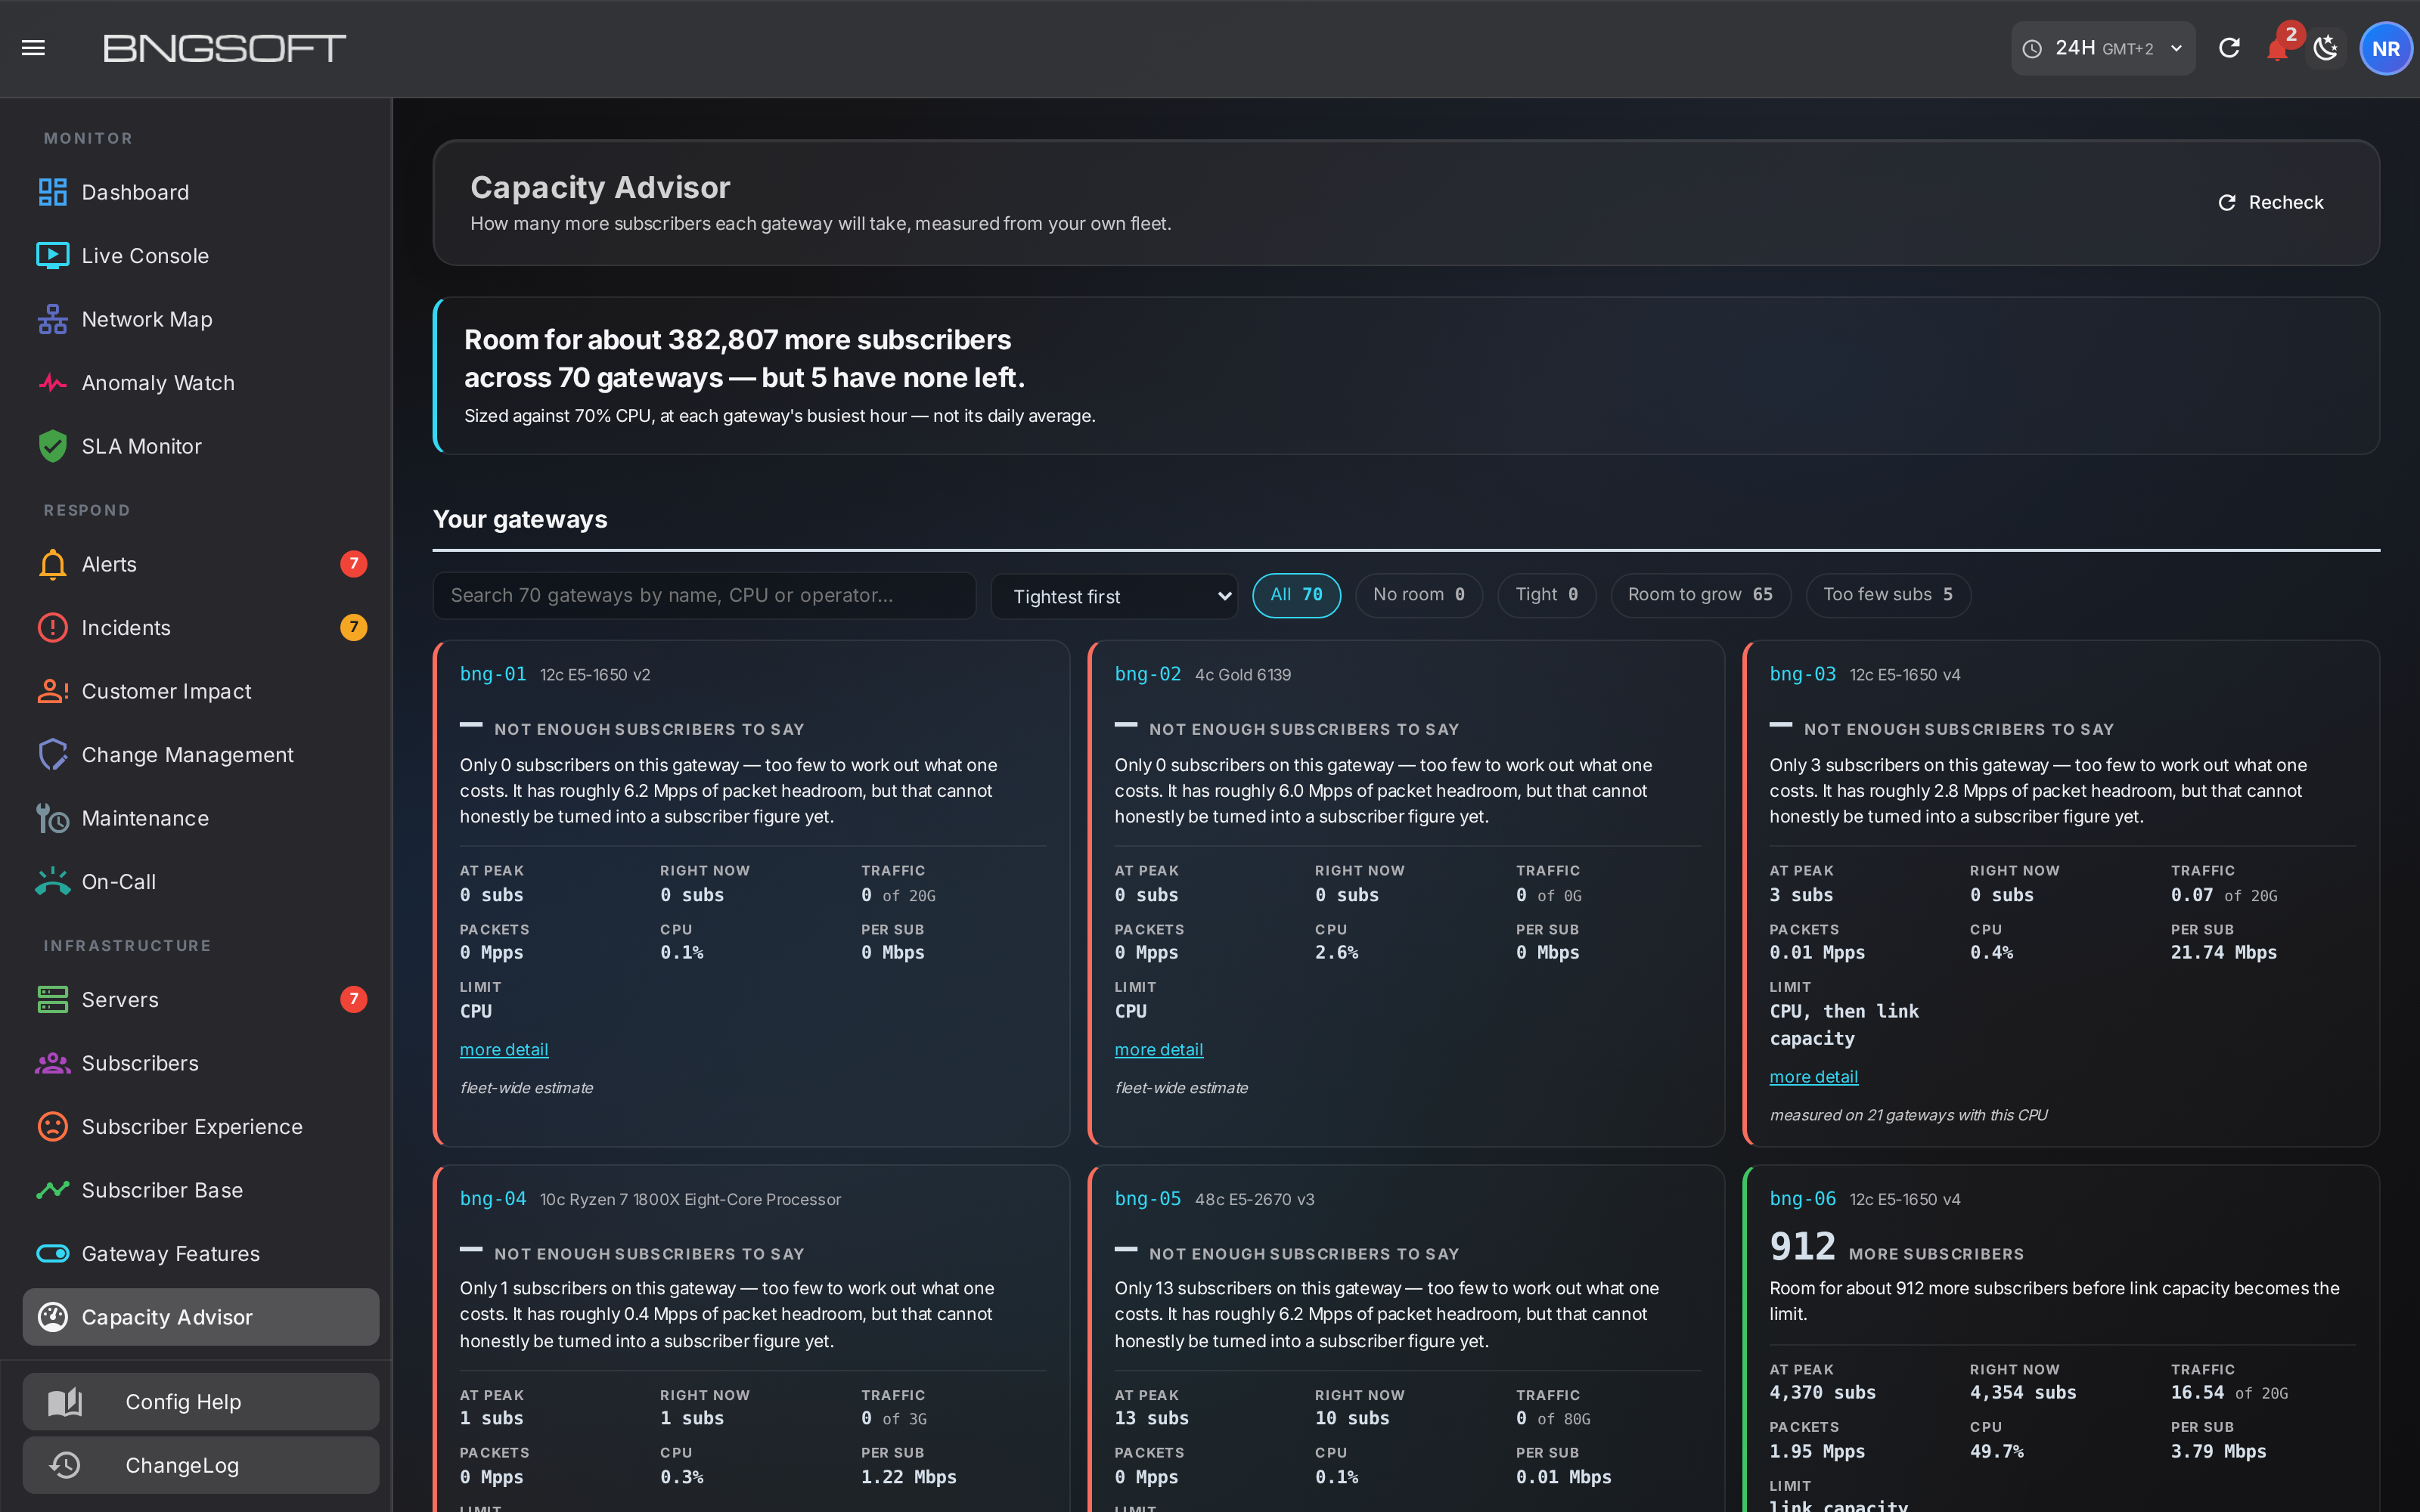
What this does not claim
This is a correlation study, not a benchmark. It says subscriber count and packet rate do not predict CPU consumption across a real fleet. It does not isolate which configuration or hardware factor dominates — that varies per gateway, which is the point.
Every gateway here runs the same forwarding platform. The 10× spread is not a comparison between vendors. It is the spread within one platform, caused by deployment differences — which is exactly why a single published number cannot describe your box.
The window is short. Correlations are computed over a three-hour sample across 68 gateways. Longer windows change individual gateways; they have not changed the finding.
The one number worth quoting
If you need a planning figure today, use the one that is actually predictable. Across the same fleet, at the busy hour, subscriber demand sits in a strikingly tight band — and unlike CPU, it travels between operators. That measurement is the companion to this document.
Size your uplinks from your subscriber count. Size your CPU from your own telemetry. One of those two is a solved problem and the other cannot be solved on paper — and most sizing exercises get this exactly backwards.
About the data. Figures are taken from production telemetry across eight independent operators. Gateways are identified as A, B and C only; no operator name, hostname, site, region or subscriber identifier appears in this document, and no per-operator figure is published. Correlations are Pearson coefficients over 68 gateways with more than 200 active subscribers. CPU is converted to busy cores as cpu% × installed cores ÷ 100 so that machines with different core counts are comparable. Packet rates are counter deltas over the sample window, summed across physical interfaces only, with bonded members excluded to avoid double counting. About the screenshots. Every screen shown is a real production console. Gateway hostnames are replaced with placeholders before the image is captured, and no operator name, site, region, subscriber identifier or address appears in any image. CPU models are left intact: they describe hardware, not a customer.